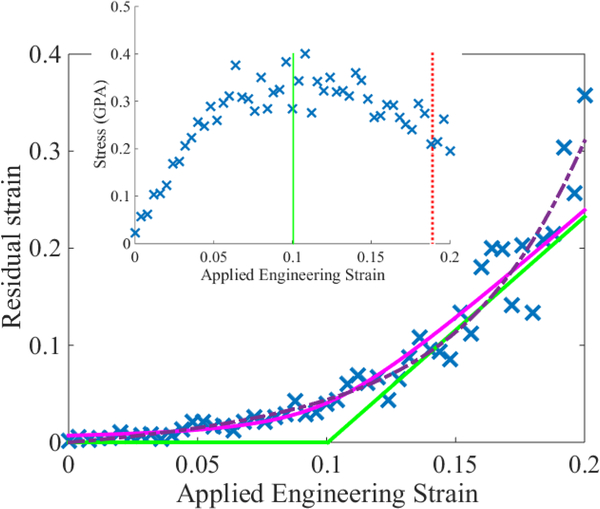
Figure 7:
Comparison of hyperbolas computed via Eq. (4) when ς2 = 1 (dashed purple) and ς2 = R(q, ϵ) (pink with green asymptotes). The inset shows the corresponding stress-strain data with the hyperbola-based yield estimates indicated by vertical lines; colors and linestyles have the same meaning as in Fig. 6. This dataset comes from another 5000 atom 33MY simulation. Vertical error bars are not visible on the scale of the plot; see Appendix A.

