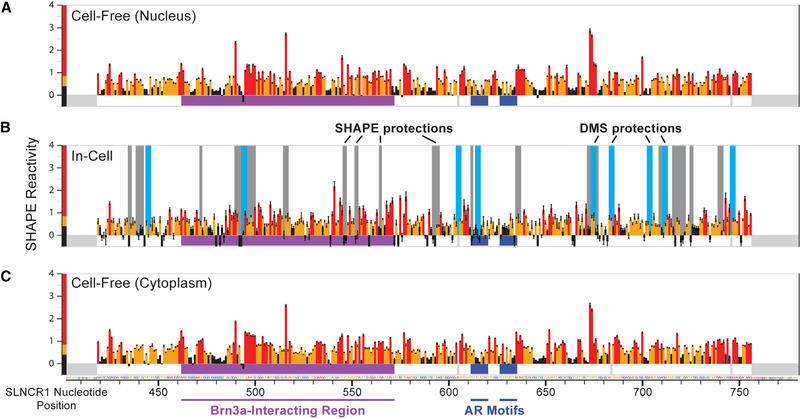
Figure 4. AR and Brn3a Binding Sites Reside within an Unstructured Region of SLNCR1, In Vivo.
Reactivity profiles for nucleotides 403–780 of the SLNCR1 RNA from SHAPE-MaP of (A) cell-free nuclear RNA, (B) in-cell total cellular RNA, and (C) cell-free cytoplasmic RNA. SHAPE reactivities are colored bythe relativevalue (see scale) and SE is indicated. Significant in-cell protectionsfrom SHAPE (gray) and DMS (light blue) reactivity are indicated by vertical bars. The location of Brn3a and AR interaction sites are labeled with horizontal purple and dark blue lines, respectively. Nucleotides included in amplification primers and high-background positions (thus classified as no data) are indicated with gray rectangles below zero. See also Figures S4 and S5.

