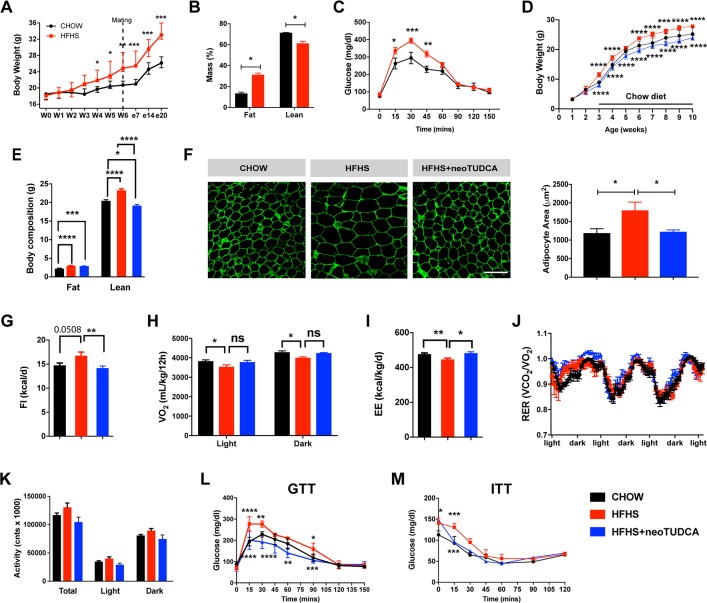
Fig 1. Maternal obesity impairs energy balance and glucose homeostasis in the offspring and neonatal TUDCA treatment improves this metabolic malprogramming.
(A) Body weight curves of adult female mice fed a chow or an HFHS diet before and during pregnancy (n = 5 per group). (B) Body composition (n = 3 per group) and (C) GTT (n = 4–5 per group) of pregnant female mice fed a chow or HFHS diet at gestational day 16. (D) Body weight curves of mice born to chow-fed dams, HFHS-fed dams, or HFHS-fed dams and treated with neoTUDCA (n = 5–10 per group). (E) Average body composition (n = 5–8 per group) and (F) representative images and quantification of adipocyte size (immunostained for perilipin, green fluorescence) of 10-week-old mice born to chow-fed dams, HFHS-fed dams, or HFHS-fed dams and treated with TUDCA neonatally (n = 4–5 per group). (G) Food intake, (H) oxygen consumption, (I) energy expenditure, (J) RER, and (K) locomotor activity of 10-week-old mice born to chow-fed dams, HFHS-fed dams, or HFHS-fed dams and treated with TUDCA neonatally (n = 3–8 per group). (L) GTT and (M) ITT of 7- to 8-week-old mice born to chow-fed dams, HFHS-fed dams, or HFHS-fed dams and treated with TUDCA neonatally (n = 4–8 per group). Data are presented as mean ± SEM (panels A, C, D, J, L, M) or mean + SEM (panels B, E–I, K). *P ≤ 0.05, **P ≤ 0.01, ***P ≤ 0.001, and ****P ≤ 0.0001 versus chow groups. Statistical significance between groups was determined by one-way ANOVA (panels E–G, I–K), and two-way ANOVA (A–D, H, L, M) followed by Tukey’s Multiple Comparison test. Scale bar, 100 μm. The underlying data are provided in S1 Data. GTT, glucose tolerance test; HFHS, high-fat high-sucrose; ITT, insulin tolerance test; neoTUDCA, tauroursodeoxycholic acid given neonatally; RER, respiratory exchange ratio; TUDCA, tauroursodeoxycholic acid.

