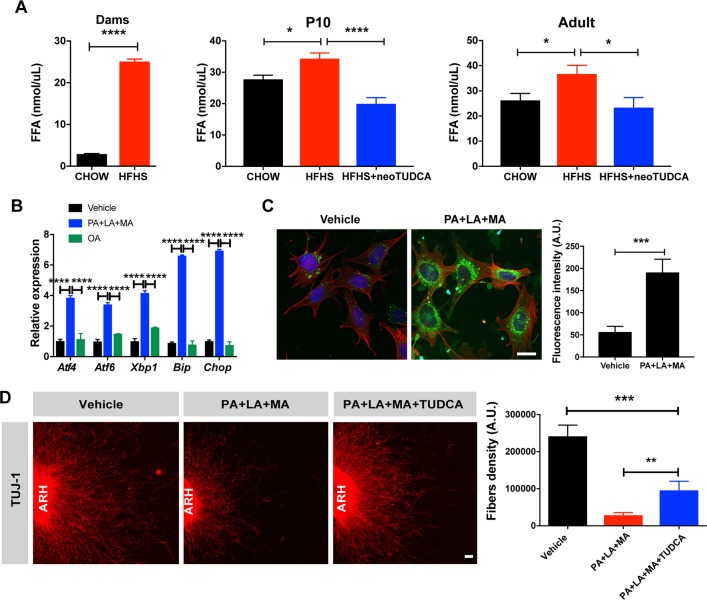
Fig 5. Saturated fatty acid treatment causes ER stress-induced disruption of axon growth.
(A) Serum fatty acid levels in dams, P10 and 10-week-old mice born to chow-fed dams, HFHS-fed dams, or HFHS-fed dams and treated with TUDCA neonatally (n = 4–7 per group). (B) Relative expression of Atf4, Atf6, Xbp1, Bip, and Chop mRNA in mouse hypothalamic mHypoE-N43/5 cells treated with vehicle (BSA with 0.1% ethanol), or a cocktail of palmitate (250 μM) with lauric (1 mM) and myristic acids (200 μM) (PA+LA+MA), or OA alone for 24 h (n = 4–5 cultures per condition). (C) Representative images and quantification of the density of long-chain fatty acid analog BODIPY (green fluorescence) immunoreactivity in mHypoE-N43/5 cells treated with vehicle (BSA with 0.1% ethanol) or palmitate (250 μM) with lauric (1 mM) and myristic acids (200 μM) (PA+LA+MA) for 24 h (n = 5–7 cultures per condition). Red fluorescence and blue fluorescence depict actin filaments phalloidin and DAPI nuclear staining, respectively. (D) Confocal images and quantification of TUJ1 (neuron-specific class III beta-tubulin) immunoreactive fibers derived from isolated ARH explants incubated with vehicle (0.1% ethanol) or a combination of palmitate (250 μM) with lauric (1 mM) and myristic acids (200 μM) (PA+LA+MA) with or without TUDCA (750 μg/ml, n = 6 cultures per condition). Data are presented as mean + SEM. *P < 0.05, **P ≤ 0.01, ***P < 0.001 versus other groups. Statistical significance was determined by unpaired two-tailed Student t test (A, C, D), two-way ANOVA followed by Tukey’s Multiple Comparison test (B). Scale bars, 20 μm (C), and 50 μm (D). The underlying data are provided in S1 Data. ARH, arcuate nucleus; ER, endoplasmic reticulum; HFHS, high-fat high-sucrose; neoTUDCA, tauroursodeoxycholic acid given neonatally; OA, oleic acid; TUDCA, tauroursodeoxycholic acid; TUJ1, neuron-specific Class III β-tubulin.

