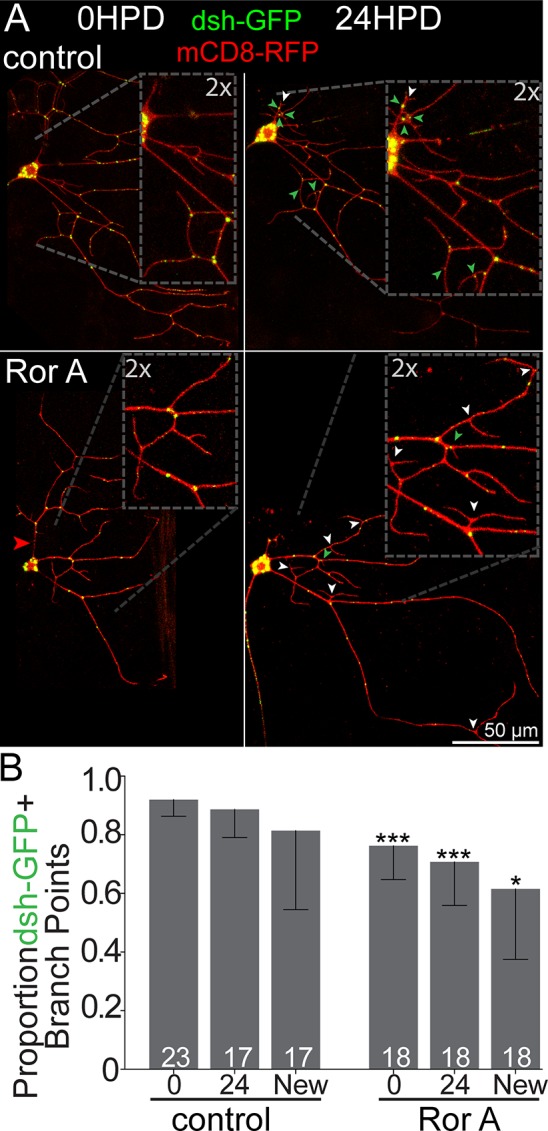
Fig 7. dsh localization at baseline and during dendrite regeneration.

(A) UAS-dsh-GFP expressed under control of 221-Gal4 with UAS-mCD8-mRFPas a cell-shape marker at baseline (left) and 24 HPD (right). Red arrowheads denote cut sites; green arrowheads show new branch points positive for dsh-GFP, while white arrowheads show GFP-negative new branch points. (B) Quantification of dsh-GFP+ branchpoints at baseline and 24 HPD in control and Ror RNAi. For 24 HPD, the total number of branch points with dsh-GFP is shown in the 24 column, and newly added branch points are also shown separately. Mann–Whitney U test, *P < 0.05, **P < 0.01, ***P < 0.001. Bars show mean; error bars are standard deviation; sample size represents individual animals/neurons. Quantitation is contained in S1 Data. dsh, dishevelled; GFP, green fluorescent protein; HPD, hours postdendrotomy; RNAi, RNA interference; Ror, RTK-like orphan receptor; RTK, receptor tyrosine kinase; UAS, upstream activating sequence.
