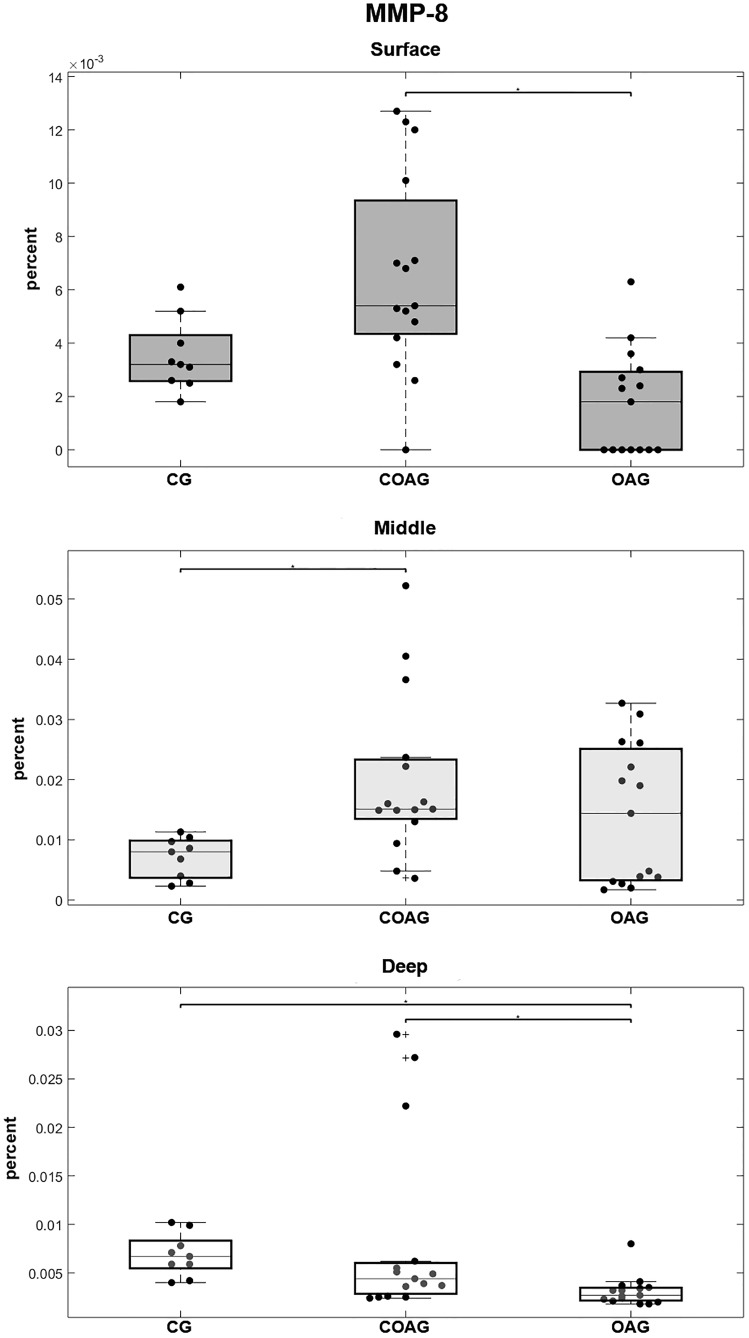
Fig 6. Quantification of MMP-8 expression.
The COAG showed a significant difference in MMP-8 expression in the surface layer compared with that in the OAG (p = 0.0001). The CG displayed a significant difference in MMP-8 expression in the middle layer compared with that in the COAG (p = 0.0243). The CG and COAG showed significant differences in MMP-8 expression in the deep layer compared with that in the OAG (p = 0.0005 and p = 0.0293, respectively); p<0.05.

