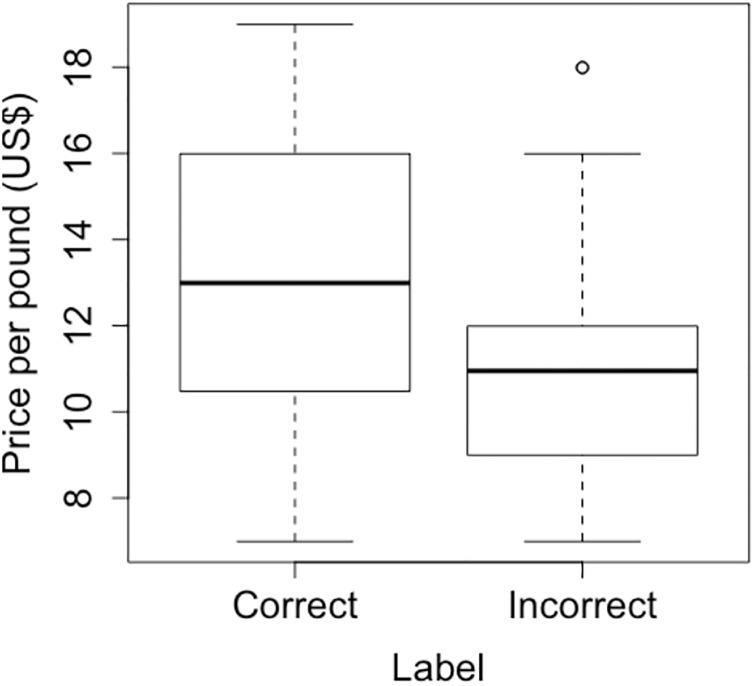
Fig 2. Price of correctly labeled and mislabeled shrimp purchased in North Carolina.
Boxplots of the distribution of price per pound of all shrimp that were found to be correctly labeled as “local” compared the price of shrimp incorrectly labeled as “local”. The difference was statistically significant (p-value = 0.001, t-test).

