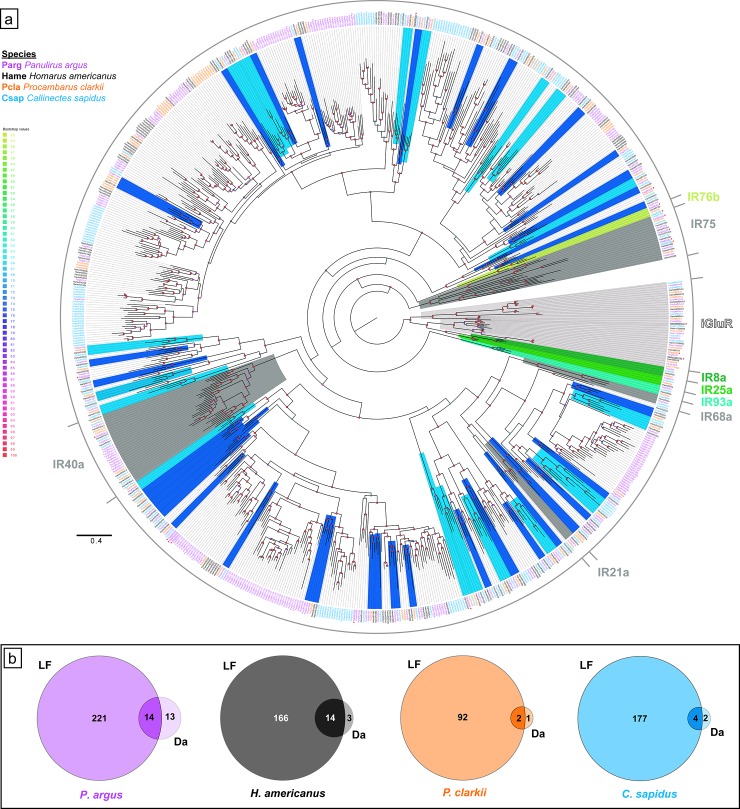
Fig 4. Phylogenetic tree of IRs in four decapod species and tissue expression.
a. Maximum likelihood phylogenetic tree of IRs and iGluRs from four decapod crustaceans. Clades with co-receptor IRs (IR25a, IR8a, IR76b, and IR93a) are colored in shades of green; clades with tuning IRs that are conserved across crustaceans and insects (IR21a, IR40a, IR68a, and IR75-family) are colored dark grey; clades with tuning IRs that are conserved across all four decapod crustaceans are colored light blue; clades with tuning IRs that are conserved in at least three decapod crustaceans are colored dark blue; clades with iGluRs are colored light grey. * with underline indicates higher expression in dactyl than LF. The tree was built using IQ-Tree with 1000 UFBoot replications under the WAG+F+G4 model of substitution according to BIC as selected by ModelFinder. The tree was visualized on FigTree v.1.4.4. The tree is unrooted but the root is drawn at the iGluR/IR25a/IR8a clade. Scale bar represents expected number of substitutions per site. b. Venn diagrams showing tissue specific differential expression (LF–lateral flagella of antennules, Da–dactyls of walking legs) of IRs and iGluRs in each decapod crustacean as calculated by DESeq2, where a ~ 2.8 fold difference or greater in expression (i.e. log2[fold change] ≥ 1.5 or log2[fold change] ≤ -1.5) between tissue types is considered higher expression in one tissue.

