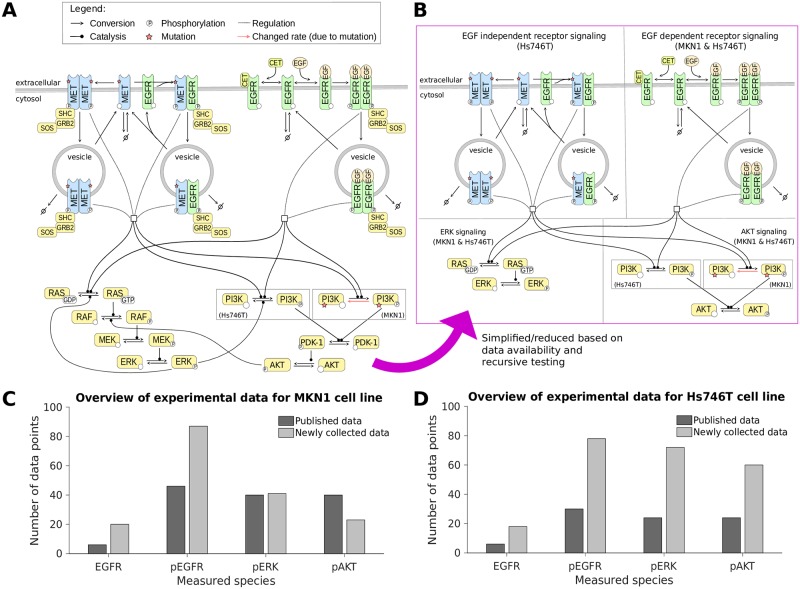
Fig 1. The pathway model and experimental data.
A: Illustration of the EGFR/MET signaling pathway, focusing on the ERK and AKT signaling cascades, used to build the mathematical model. B: Illustration of the mathematical model indicating shared and cell-line specific biochemical species/reactions. C-D: Overview of the experimental data used for model calibration for MKN1 and Hs746T cell lines. The amount of data from the literature (published by [9]) and newly collected data (published as part of this study) is distinguished.

