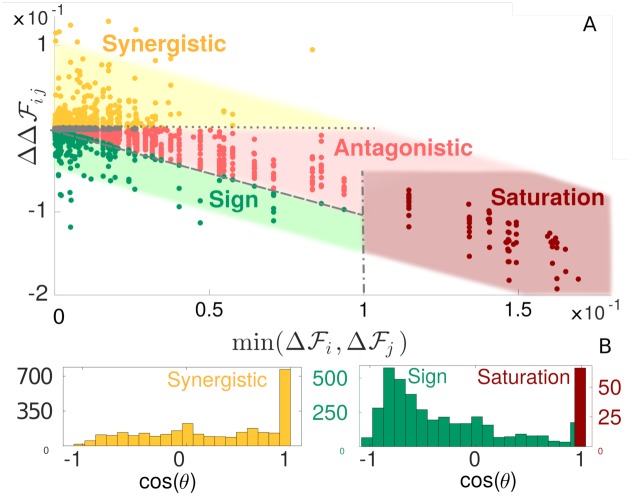
Fig 2. Classification and mechanical characterization of epistasis in our model of allosteric cooperativity.
A: Phase diagram of epistasis in our allosteric material. All quantities are averages over 50 configurations obtained in a single run. The shaded area is taken with arbitrary width and a -1 slope as a guide to the eye. We show the lines (dotted style), which corresponds to no epistasis (and divides synergistic from antagonistic/sign epistasis), (dashed style), separating sign and antagonistic epistasis, and (dash-dotted style), the threshold set to distinguish lethal mutations (corresponding to the saturation region). Points in grey correspond to epistasis < 5 × 10⁻⁴ and are excluded from our analysis. B: Histograms of cos(θ) for synergistic, sign and saturation epistasis.

