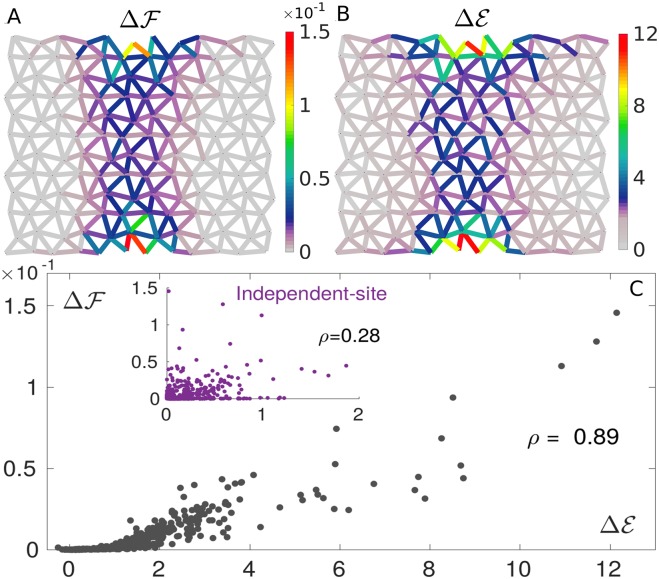
Fig 3. Prediction of mutation costs by DCA.
Maps of true (A) and DCA-inferred (B) single mutation costs, averaged over 1.5 × 10³ configurations randomly chosen from the MSA. Their patterns are very similar, revealing high costs near the allosteric and active sites and in the shear path connecting them. C: Scatter plot showing the strong correlation between and for all links (averaged over 1.5 × 10³ configurations). The estimation of mutation costs based on an independent-site model (i.e. on conservation) correlates poorly with the true cost (inset), proving the need for incorporating correlations for proper prediction of mutation costs. The correlation is quantified via the Pearson correlation coefficient, ρ.

