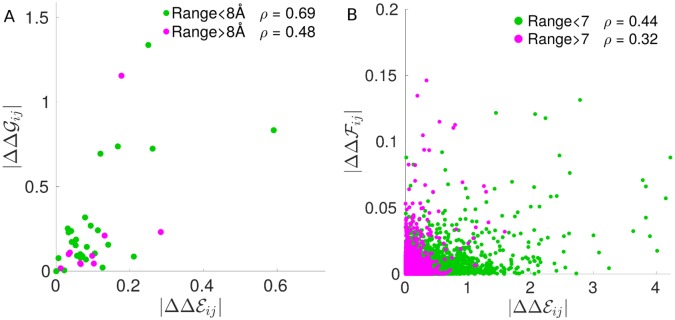
Fig 8. Prediction of experimentally measured epistasis by DCA from [12].
A: Scatter plot of average epistasis magnitude vs DCA-inferred energetic couplings , where the color code distinguishes short and long distance pairs of residues on the PDZ α2-helix three-dimensional structure. ρ, the Pearson correlation coefficient, indicates a better performance at short range. As a comparison, in B we show the scatter plot of average epistasis magnitude vs DCA-inferred energetic couplings in our in silico evolved networks: similarly to A, the prediction at long distance is poorer than at short distance.

