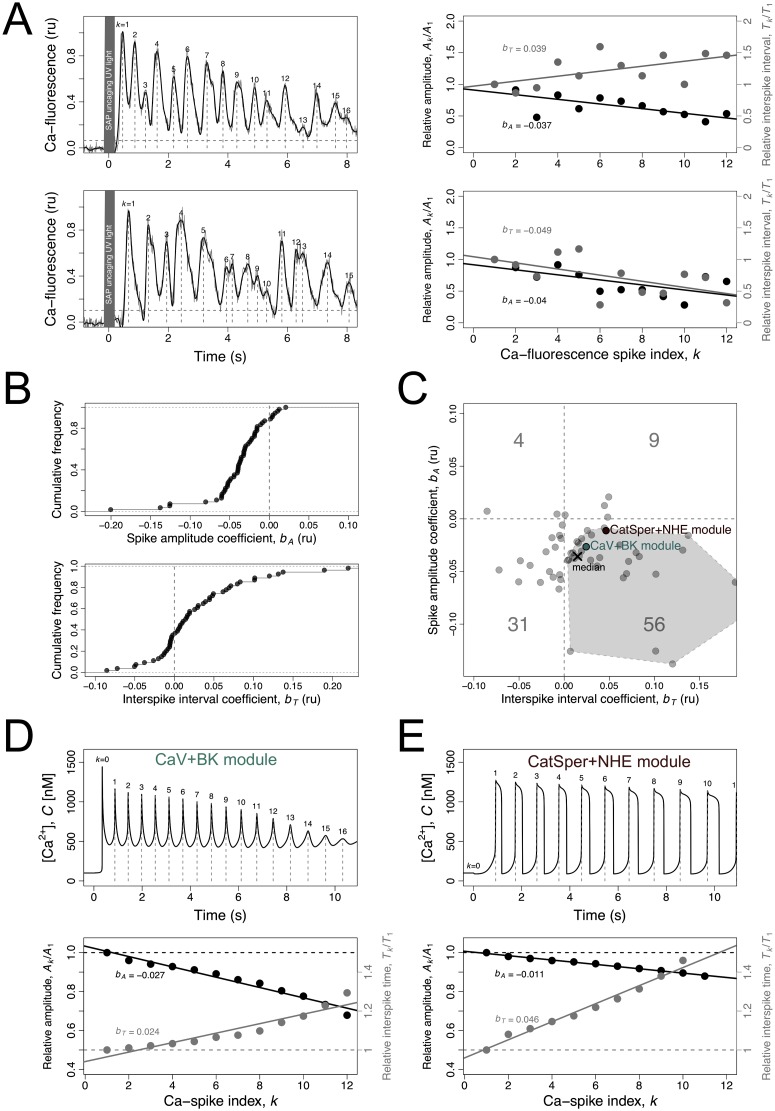
Fig 3. [Ca2+]i-spike trains produced by the sperm activating peptides in sea urchin sperm flagellum and its modelling.
A) On the left, two examples are shown of [Ca2+]i time series measured with fluorescent probes in flagella of S. purpuratus individual sperm bound to a coverslip following uncaging of Speract analogue by UV light. The raw measurements (grey) were smoothed using cubic spline (black). The Ca-spikes (vertical grey dashed lines) were calculated as the maxima in the smooth curve higher than 3x the standard deviation of the measurements pre-uncaging (horizontal gray dashed line). For each spike indexed k, the amplitude Ak and the interspike interval Tk = tk+1 − tk were calculated. The shaded region indicates the UV light pulse. On the right, the relative spike amplitude Ak/A1 (left axis; black) and relative interspike interval Tk/T1 (right axis; grey) are plotted as a function the spike index k for the two examples. The lines are linear regressions of the relative spike amplitude (black) and relative interspike interval (grey) over the spike index k from which the respective regression coefficients bA and bT were obtained. B) Cumulative frequency distributions of the spike-amplitude regression coefficient bA and interspike interval regression coefficient bT for all experimental time series analysed. C) Bivariate plot of the spike amplitude coefficient bA versus spike amplitude coefficient bA in experimental time series (gray dots). The cross indicates the median values. The numbers indicate the percentages of time series falling in the four quadrants. The polygon in the bottom-right quadrant represents the convex hull of the experimental points in the quadrant where most the time series fall in. The pink and green dots represent the numerical solution of the model represented in D and E. D, E) [Ca2+]i dynamics as predicted by the models featuring either the CaV+BK module (green) (D) or the CatSper+NHE module (E), using the reference parameters (Table 2). On top, the curves represent the numerical solutions of the variable C as a function of time. The Ca-spikes are identified (vertical dashed lines) and indexed by k (labels). The relative spike amplitude and relative interspike interval are plotted as function of spike index k on the bottom graph together with the regression lines used to obtain the regression coefficients bA and bT for the model, which were represented in C.

