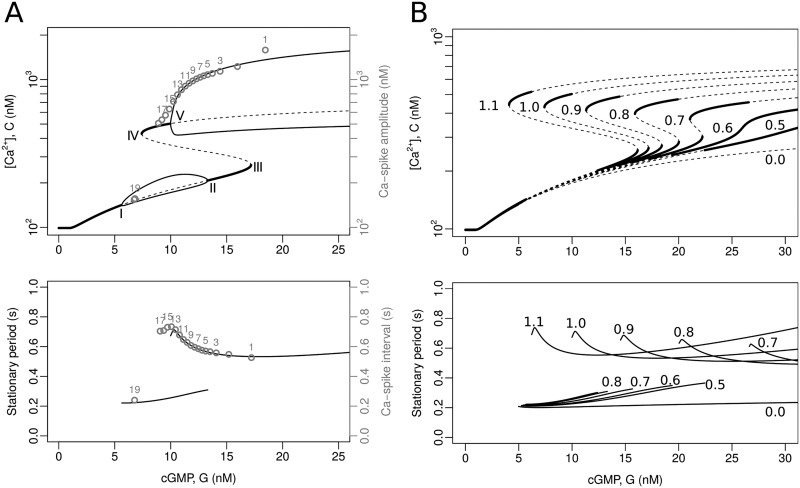
Fig 5. Bifurcation analysis of the model featuring the CaV+BK module.
In this analysis, cGMP concentration is a constant input, i.e. G is the bifurcation parameter and the upstream variables are ignored, thus reducing the state space to ,, V, ,, fbk, C}. A) Bifurcation diagrams calculated with XPPAUT [24] using the reference parameters (Table 2). Top: the graphs show the C variable ([Ca2+]i) as a function of the input parameter G (cGMP concentration). The thick continuous lines are stable equilibria, the dashed ones indicate unstable equilibria, the thin continuous lines are the maxima and minima of stable limit cycles. The bifurcation points are marked with Roman numerals (I to V). The numbered grey circles indicate the peak value for consecutive spikes obtained by numerically solving the complete model (see Fig 4). Bottom: the solid lines represent the period of stable limit cycles as a function of the constant input G. The numbered gray circles correspond to the interspike interval in the numerical solutions, as in the top graph. B) Bifurcation diagrams parameterised by maximal BK conductance density (gbk). Top and bottom: the lines are as in the graphs in (A); for clarity, the minima and maxima of the limit cycles are omitted. The numbers in the range of 0.0 to 1.1 are the fold change factors multiplying the reference value of gbk (e.g. the curves labelled 1.0 coincide with those of (A), whereas the curves marked 0.0 correspond to a cell without BK channels).

