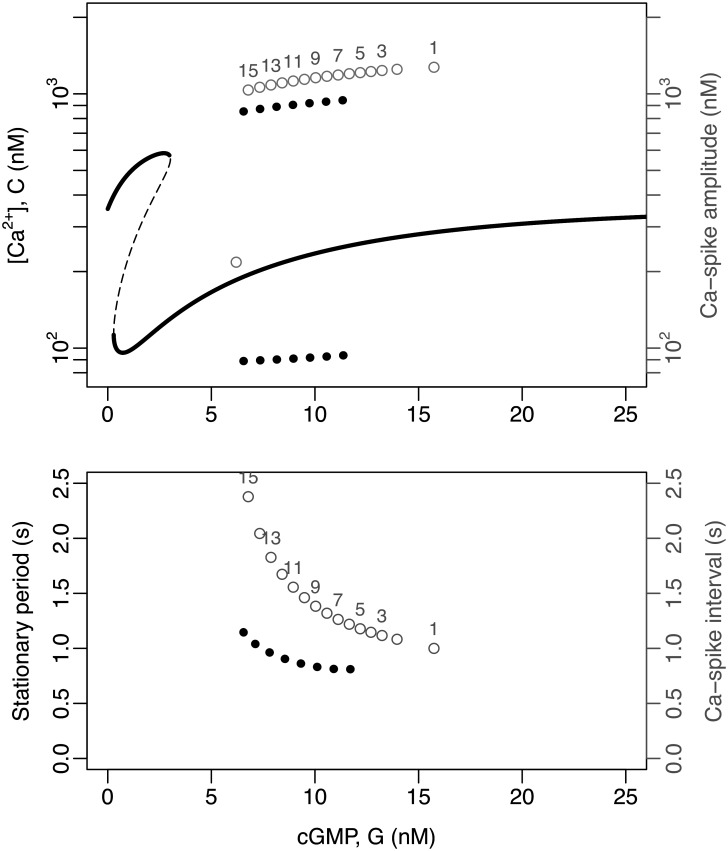
Fig 7. Bifurcation analysis of the model featuring the CatSper+NHE module.
The analysis was done under conditions wherein cGMP is defined as a constant input (G = constant) and upstream variables ignored reducing the state space to ,, V, , mcs, hcs, C, H}. Top: The graphs depict the variable C ([Ca2+]i) as a function of the input parameter G (cGMP concentration). The thick continuous lines are the stable equilibria and the dashed lines indicate unstable equilibria, as obtained by XPPAUT [24]. The thick dotted lines are the maxima and minima of the stable limit cycle obtained by numerical solutions of the system under random initial conditions. The numbered gray dots indicate the maxima and minima of the consecutive spikes obtained by solving numerically the full model, corresponding to those depicted in Fig 4. Bottom: The dotted lines represent the period of the stable limit cycles as a function of the constant input G obtained by numerical solutions. The numbered grey dots correspond to the interspike interval in the numerical solutions, as in the top graph.

