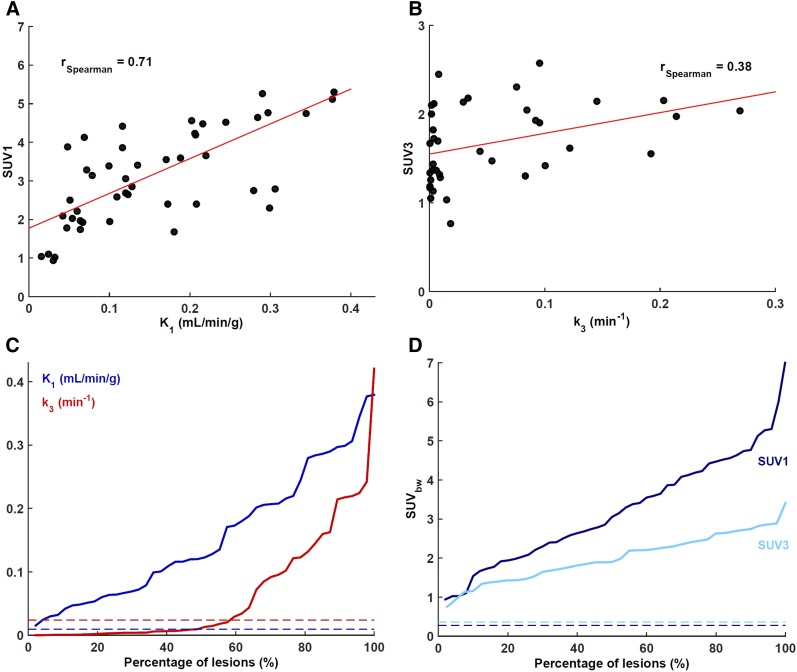
FIGURE 2.
(A) Scatterplot of maximum intratumor K1-SUV1. K1 was the kinetic rate constant most closely correlated with SUV1 (measured on last dynamic 5-min frame, 25–30 min after injection). (B) Scatterplot of maximum intratumor k3-SUV3. (C) Waterfall chart of maximum intratumor K1 and k3. (D) Waterfall chart of maximum intratumor SUV1 and SUV3. In both waterfall charts, averages for normal brain tissue are shown as color-coded dashed lines.

