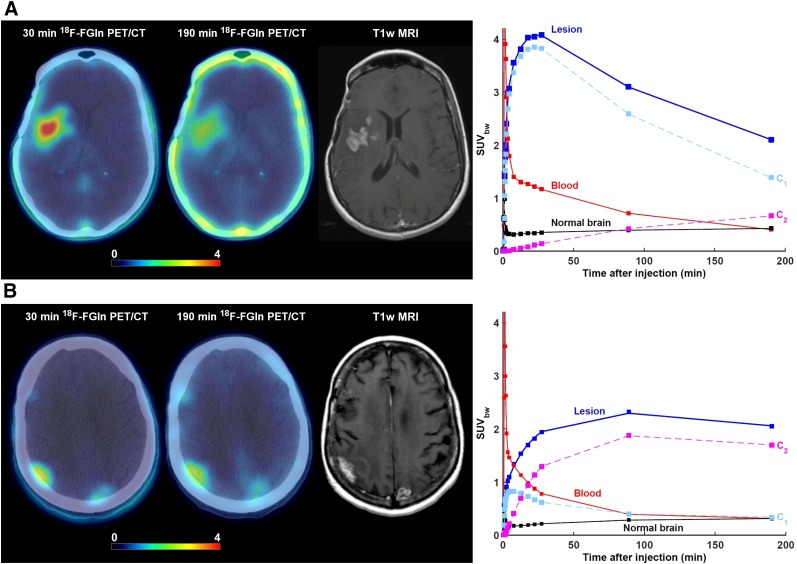
FIGURE 3.
Lesions from 2 patients exhibiting different 18F-FGln pharmacokinetics despite having very similar SUV corrected by body weight (SUVbw) as measured at 190 min after injection. In both cases, axial view of last dynamic PET frame (5-min acquisition time, 25–30 min after injection) and last imaging frame (∼190 min after injection), fused with corresponding CT, is displayed. Gadolinium-enhanced T1-weighted MRI is included for comparison. Three time–activity curves are shown: for whole lesion; image-derived input function scaled by whole-blood activity concentration as measured from blood samples, patient-specific plasma fraction, and population-based metabolite fraction; and normal brain tissue. Contributions to total PET signal for tumor time–activity curves are shown for first compartment (C1) and second compartment (C2). (A) 52-y-old woman with confirmed diagnosis of astrocytoma. 18F-FGln PET/CT shows 2 cm3 lesion in right frontotemporal region. Mean intratumor K1, k2, k3, k4, and VT were 0.28 mL/min/g, 0.08 min−1, 0.002 min−1, 0.001 min−1, and 3.9 mL/cm3, respectively. Corresponding values for normal brain tissue were 0.02 mL/min/g, 0.09 min−1, 0.001 min−1, 0.001 min−1, and 0.5 mL/cm3, respectively. SUVbw at 30, 90, and 190 min was 4.0, 3.1, and 2.1, respectively. At these 3 time points, signal from second compartment contributed 3%, 14%, and 32% of total PET activity concentration. (B) 70-y-old woman with confirmed diagnosis of non–small cell lung cancer that metastasized to brain. PET image shows metastatic lesion in right parietal region. Mean intratumor K1, k2, k3, k4, and VT were 0.13 mL/min/g, 0.13 min−1, 0.09 min−1, 0.02 min−1, and 5.1 mL/cm3, respectively. Corresponding values for normal brain tissue were 0.01 mL/min/g, 0.05 min−1, 0.04 min−1, 0.004 min−1, and 0.7 mL/cm3, respectively. SUVbw at 30, 90, and 190 min was 1.9, 3.1, and 2.1, respectively. At these 3 time points, signal from second compartment contributed 66%, 82%, and 83%, respectively, of total PET activity concentration.

