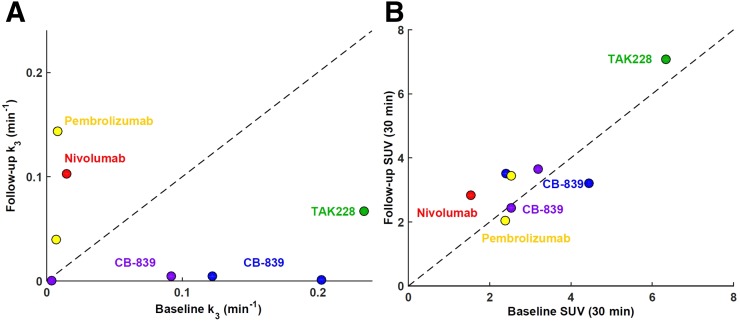
FIGURE 4.
(A) Scatterplot of baseline vs. follow-up mean intratumor k3 for 5 patients (8 lesions in total) who underwent 2 18F-FGln dynamic PET scans. Every patient is color-coded and annotated according to therapy received between baseline and follow-up PET. Line of identity is shown as dashed line. (B) Corresponding scatterplot of baseline vs. follow-up mean intratumor SUV as measured at 30 min after injection.

