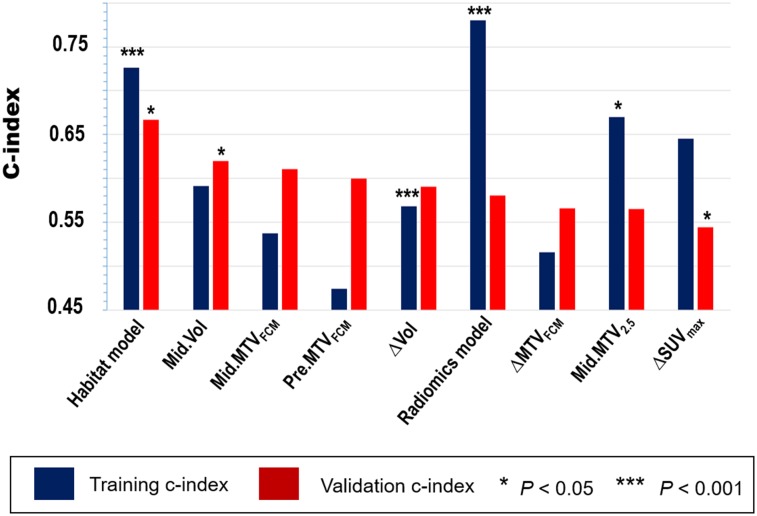
FIGURE 6.
Accuracy of predicting PFS as measured by C-index for habitat-based imaging signature, compared with top-ranked conventional imaging features from PET and CT images extracted, respectively, at pretreatment, midtreatment, or change (mid–pre). comparison was performed separately in training and validation cohorts. features were ranked by C-index of validation. ∆ = mid − pre; MTVFCM = MTV adaptively defined using fuzzy c-means algorithm; MTV2.5 = MTV defined using SUV of 2.5 as cutoff.

