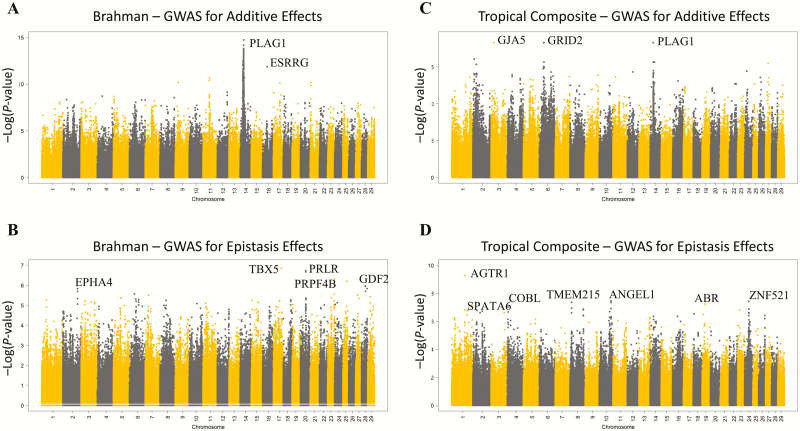
Figure 3.
Genome-wide additive and epistasis association: Manhattan plots of the additive (A and C) and buffering epistatic (B and D) association of SNPs across the 29 bovine autosomal chromosomes for the Brahman (A and B) and Tropical Composite (C and D) populations. The most likely candidate genes in the most significantly associated regions are annotated where an obvious candidate could be identified according to the bovine reference genome assembly ARS-UCS1.2. SNPs on odd-numbered chromosomes are in black and those on even-numbered chromosomes are in yellow.

