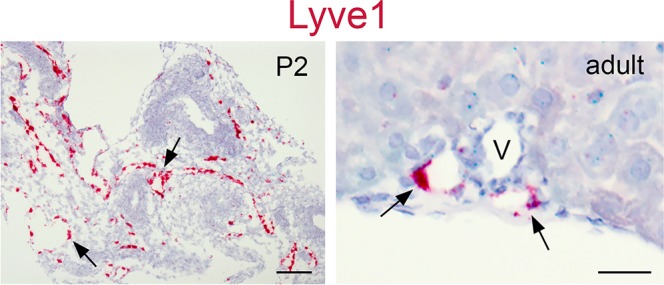
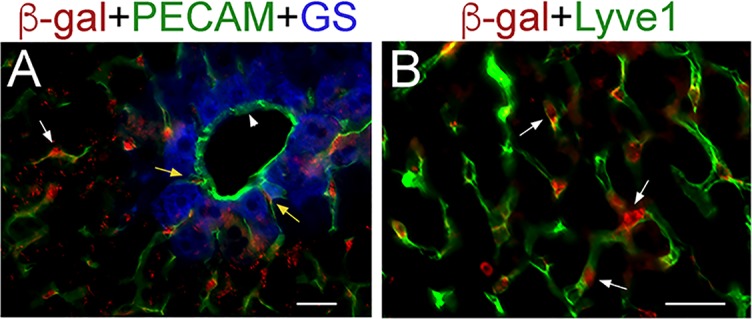
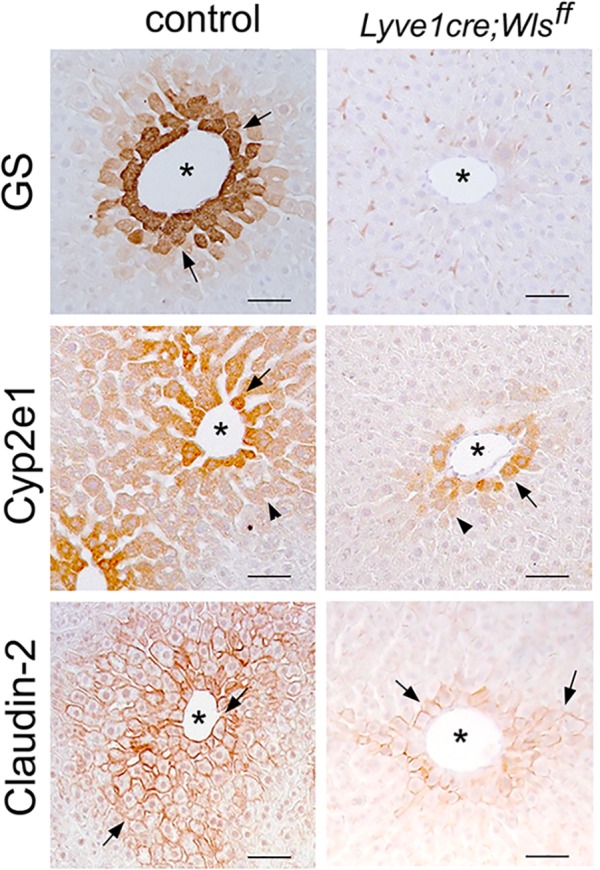
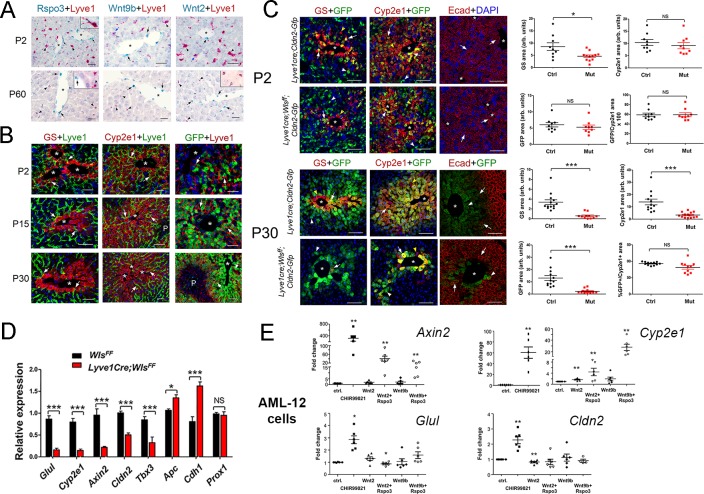
Figure 3. Lack of Wnt ligand secretion from LSECs impairs adult zonation maintenance.
(A) Double in situ hybridization for Rspo3 (green), Wnt9b (green) and Wnt2 (green) showing a few LSCEs (Lyve1+, red) expressing those transcripts (blue arrows and inset) in P2 livers. Only Wnt2 transcripts are detected in some LSECs (inset) in P60 livers. Arrows indicate central vein endothelial cells and arrowheads indicate LSECs. Scale bars: 25 μm. Each image is representative of 3 individual mice (n = 3). (B) Double-immunofluorescence results show that hepatic Zones 3 (GS+) and 2/3 (Cyp2e1+) are densely irrigated by the hepatic sinusoids (Lyve1+, arrows) in P2, P15 and P30 wildtype livers. The sinusoidal vasculature (arrows) is also in direct contact with claudin-2/GFP+ hepatocytes in P2, P15 and P30 Cldn2-EGFP livers. Scale bars: 50 μm. Each image is representative of 2–4 individual mice (n = 2–4). (C) P2, Quantitative double immunofluorescence results show that Zone 2 (Cyp2e1+, claudin-2/GFP+) is relatively unchanged and Zone 3 (GS+) is significantly reduced in Lyve1-Cre;Wlsf/f;Cldn2-GFP livers at P2. E-cadherin expression (arrows) is indistinguishable in P2 livers with or without endothelial Wls-deletion. P30, Similar quantitative results demonstrate that GS+ hepatocytes are nearly absent, Zone 2 (Cyp2e1+/GFP+) is significantly reduced and restricted to pericentral areas, and E-cadherin expression (arrows, arrowheads are GFP+ hepatocytes) is expanded towards the central veins in P30 Lyve1-Cre;Wlsf/f;Cldn2-GFP livers. 3–4 representative fields from three individual livers of each genotype were used for quantification. p values were determined by two-tailed unpaired Student’s t-test, NS, not significant (p>0.05), *p<0.05, ***p<0.001. Arrows indicate GFP-double positive hepatocytes, white arrowheads are GFP+ hepatocytes and yellow arrowheads are GFP– hepatocytes. Scale bars: 100 µm (D) Q-PCR results demonstrate reduced expression of Zone 2/3 transcripts, increased expression of Zone 1 transcripts, and normal levels of the hepatocyte transcript Prox1, in adult Lyve1-Cre;Wlsf/f livers (n = 3). p values were determined by two-way ANOVA, NS, not significant (p>0.05), *p<0.05, ***p<0.001. (E) Q-PCR results showing the effects of culturing AML-12 mouse hepatic cells with CHIR99021, Wnt2, Wntb9, or Wnt2/Wnt9b plus Rspo3 on Axin2, Cyp2e1, Glul and Cldn2 expression. p values from two-tailed unpaired Student’s t-test, *p<0.05, ***p<0.01; n = 6. (A–C) Asterisks indicate central vein lumens. Related data can be found in Figure 3—figure supplements 1–3.
Figure 3—figure supplement 1. The Lyve-1 probe used for in situ hybridization in LSECs stains lymphatic endothelial cells.

Figure 3—figure supplement 2. Lineage tracing results demonstrate selective β-gal expression in LSECs in Lyve1-Cre;ROSA-LacZ livers.

Figure 3—figure supplement 3. Wls deletion in the adult endothelium disrupts liver zonation.


