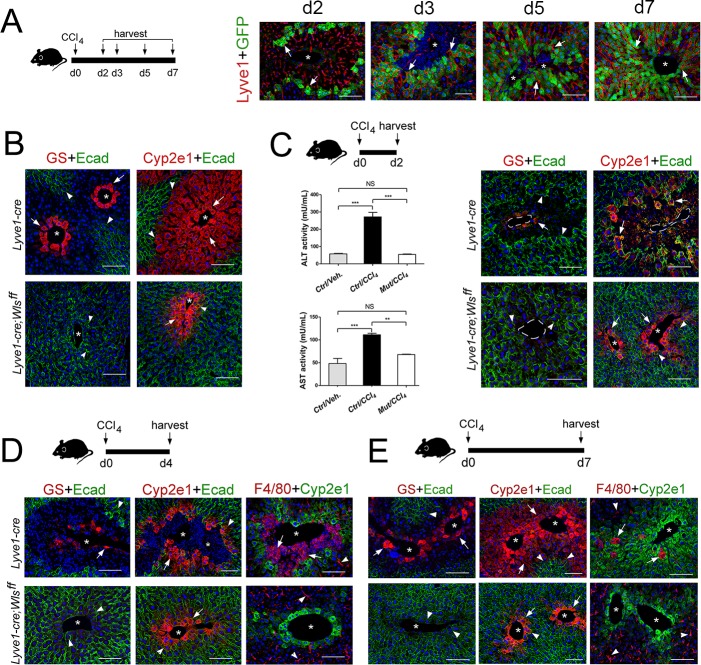
Figure 7. Lyve1-Cre;Wlsf/f mice are refractory to CCl4-induced hepatotoxicity.
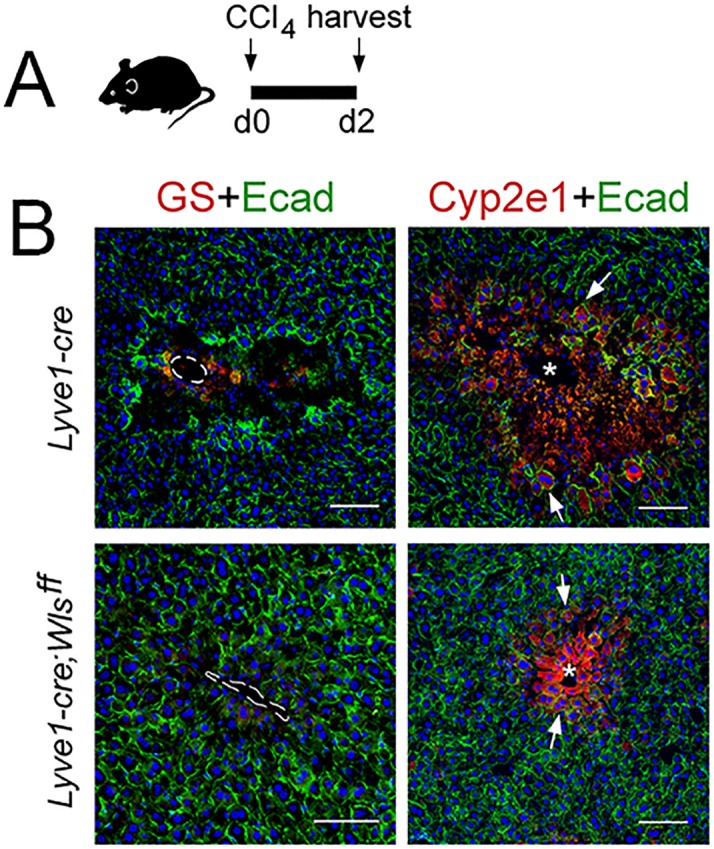
(A) (Left) Schematic of CCl4 administration and tissue harvesting using Cldn2-EGFP mice. (Right) Double-immunofluorescence results show that claudin-2/GFP+ hepatocytes (arrows) are in close proximity to the sinusoidal endothelium (Lyve1+, arrows) throughout the recovery period that follows CCl4 acute injury. (B) GS (Zone 3), Cyp2e1 (Zone 2/3) and E-cadherin (Zone 1) expression in control and Lyve1-Cre;Wlsf/f livers without CCl4 treatment. (C–E) Top: Schematics of tissue harvesting post-CCl4 administration. (C) (Left) ALT/AST serum levels indicate liver damage in Lyve1-Cre (control) mice and no liver damage in Lyve1-Cre;Wlsf/f mice, 2 days post-CCl4. p values were determined by one-way ANOVA with Bonferroni’s multiple comparisons test. NS, not significant (p>0.05), **p<0.01, ***p<0.001 (n = 3). (C–E) (top panels): Immunostaining results show that in Lyve1-Cre livers injected with CCl4, Zone 3 is nearly undetected (GS, arrows) and Zone 2 (Cyp2e1, arrows) is severely destroyed at day 2 (C); a few enucleated cells express GS (arrow) around the central vein, Zone 1 (‘E-cad’, arrowheads) is expanded, and Zone 2 (‘Cyp2e1’, arrow) is separated from the central vein by macrophage infiltrates (‘F4/80’, arrows; arrowheads are Kupffer cells) at day 4; and Zones 1–3 (‘E-cad’/‘Cyp2e1’/‘GS‘, arrows) look nearly restored and macrophage infiltrates are scarce (arrows) at day 7. (C–E) (bottom panels): GS+ cells and macrophage infiltrates are undetected and both, Cyp2e1 and E-cadherin expression are unchanged, in Lyve1-Cre;Wlsf/f livers 2–7 days post-CCl4. Each image represents 3–4 individual livers. Asterisks: central veins. Scale bars: 100 μm. Related data can be found in Figure 7—figure supplements 1 and 2.
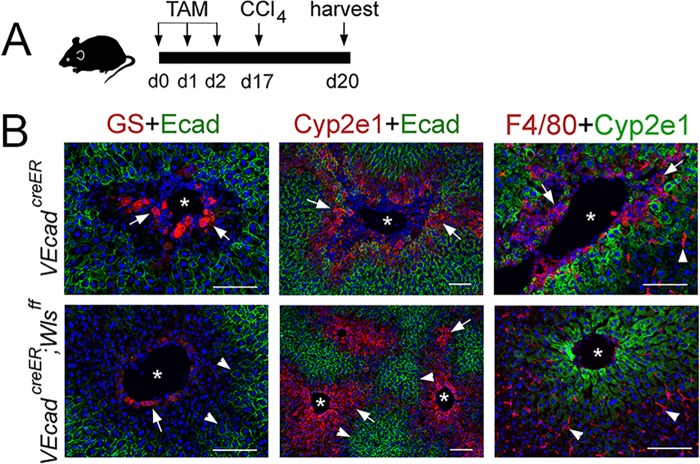
Figure 7—figure supplement 1. A CCl4-bolus does not induce hepatotoxicity in Lyve1-Cre;Wlsf/f mice.


