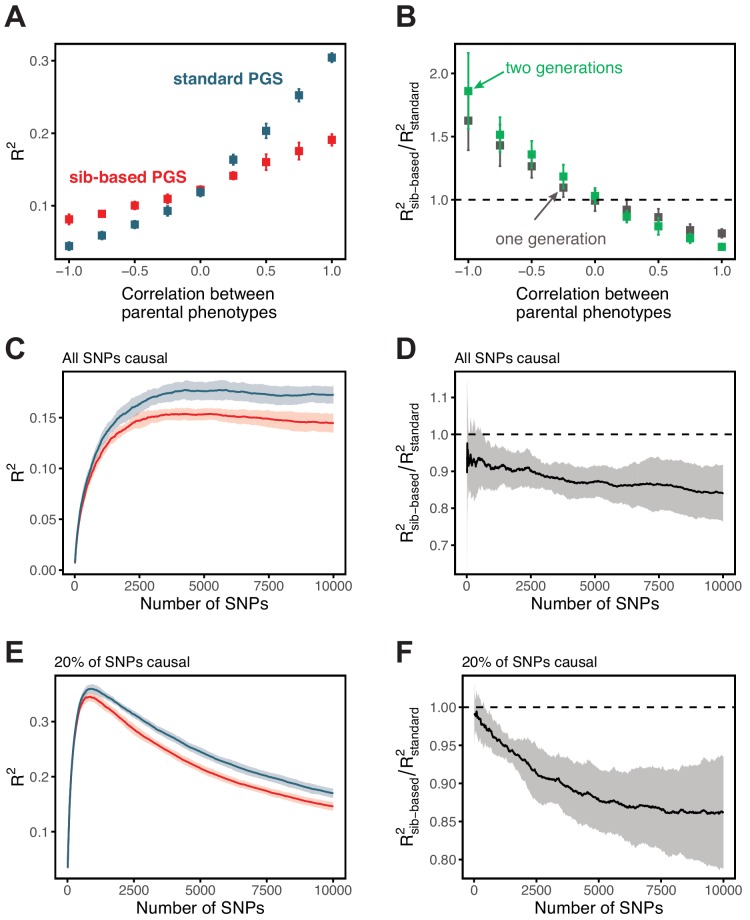
Appendix 1—figure 10. Simulation results for polygenic scores based on standard GWAS and sib-GWAS in the presence of assortative mating.
(A) Simulation results as a function of the approximate correlation between parental phenotypes, . Simulations were performed with under random mating. The size of the estimation set in the sib-GWAS is 10,000, and the size of the estimation set in the standard GWAS is chosen to match sampling variances between the two study designs. The polygenic score is based on 10,000 causal loci; its performance was evaluated in an independent set of 10,000 unrelated individuals. Standard-GWAS based polygenic scores outperforms (underperforms) sib-GWAS based polygenic scores under positive (negative) assortative mating. (B) Ratio of prediction accuracies of the polygenic scores based on sib- versus standard GWAS, as a function of , for two sets of simulations with one or two generations of assortative mating, with same parameters as in (A). (C–F) Simulation results, with the same parameters as in (A) but , as a function of the number of SNPs included in the polygenic score, with all loci being causal (C,D), or with 20% of loci being causal (E,F). SNPs are added in the order of their association p-value in an independent set of 20,000 unrelated individuals. In both cases, the ratio of prediction accuracies for scores based on sib-GWAS versus standard GWAS becomes smaller with the inclusion of more weakly associated SNPs, a behavior that is qualitatively similar to observations in Figure 3 in the main text. Points are mean ± 2 SD in 10 simulation iterations. See Section 1.4.1 for simulation details.

