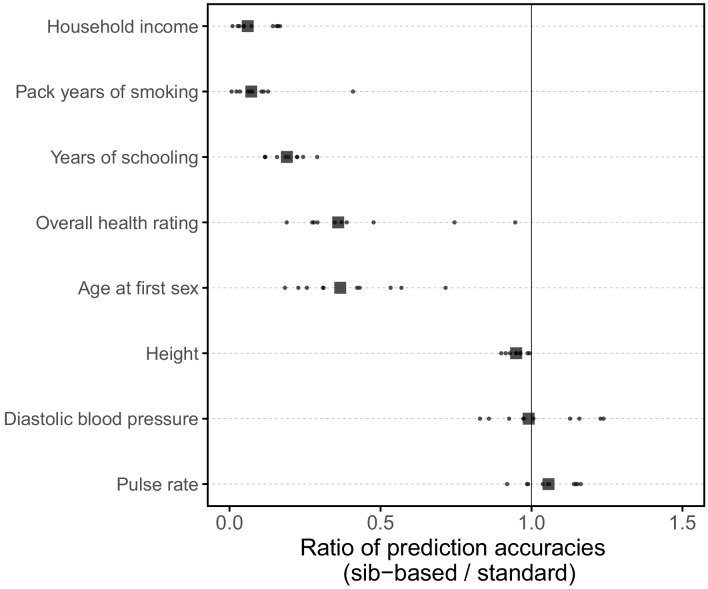
Appendix 1—figure 11. Comparison of prediction accuracies of polygenic scores based on standard and sib-GWAS matched for sex ratio.
This figure mirrors Figure 3B of the main text, but here the samples of siblings and unrelated individuals used in the analysis are matched for their sex ratios. Results are shown for diastolic blood pressure, as the prediction accuracy differed between sexes (Figure 1); the related phenotype of pulse rate; and a subset of the traits for which the prediction accuracy varied by GWAS design (Figure 3B). Small points show the ratio of the prediction accuracies in the two designs across 10 iterations; in each iteration, we resample sets of unrelated individuals to constitute three sets for discovery, estimation and prediction. Larger points show median values. We note that pulse rate is now similarly predicted by the two GWAS approaches, suggesting that perhaps the slightly higher prediction accuracy of the sib-GWAS shown in the main text Figure 3B are due to the sex ratio difference; for other traits, results are qualitatively unchanged.

