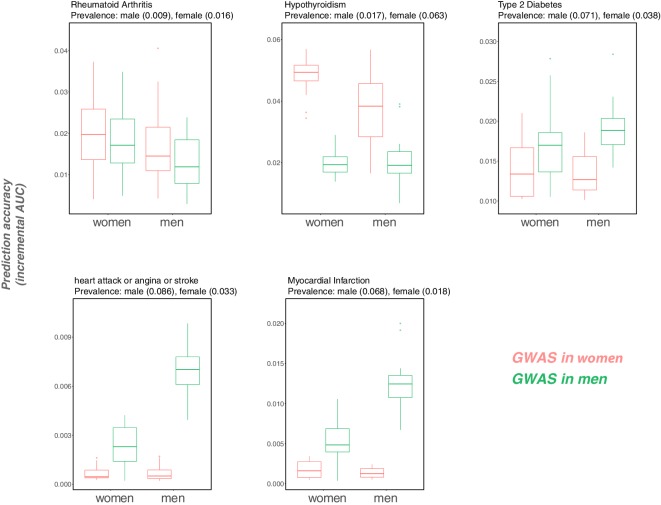
Appendix 1—figure 15. Variable prediction accuracy for binary disease phenotypes, measured as incremental AUC, in men versus women.
This figure is analogous to the one shown in Figure 1 of the main text, but looking at disease traits, and with the y-axis showing incremental AUC rather than incremental . Each box and whiskers plot was computed based on 20 iterations of resampling estimation and prediction sets. Thick horizontal lines denote the medians. The variable prediction accuracy of PGS based on GWAS in men only versus women only could be driven in part by the differences in ratios of cases to controls (and hence by differences in the precision of the effect size estimates). However, we also observe that the prediction accuracy can vary depending on the sex composition of the prediction set (e.g., for cardiovascular outcomes), an observation that cannot be attributed to differences in case:control ratios of the GWAS.

