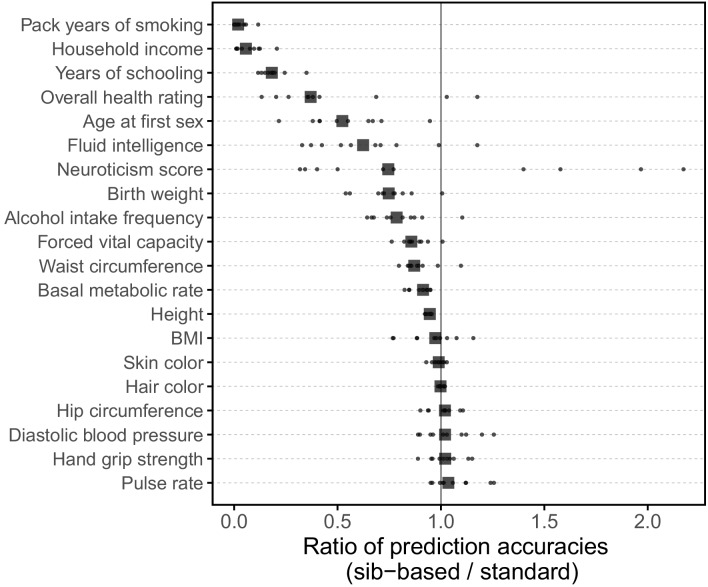
Appendix 1—figure 16. Comparison of prediction accuracies of polygenic scores (measured as ) based on standard and sib-GWAS.
This figure mirrors Figure 3B of the main text, but here we first residualized the phenotypes on covariates, and then ran the same pipeline described as that used to generate Figure 3B on the residuals without further adjustment for covariates in the GWAS or prediction evaluation. Thus, this figure relates more directly to the analytical derivation in Section 1.2. However, the results in Figure 3B and here are qualitatively similar. Small points show the ratio of the prediction accuracies in the two designs across 10 iterations; in each iteration, we resample sets of unrelated individuals to constitute three sets for discovery, estimation and prediction. Larger points show median values.

