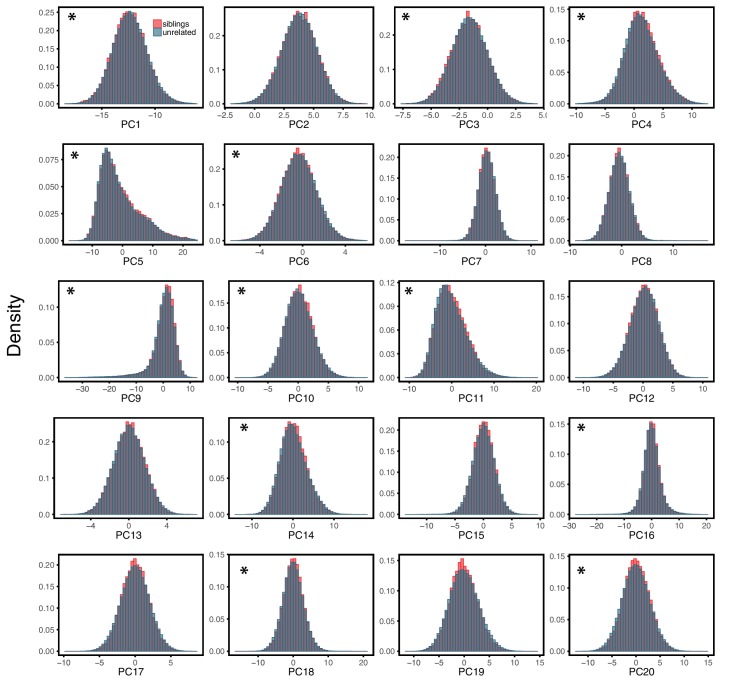
Appendix 1—figure 7. Comparison of siblings and unrelated individuals in the UK Biobank with respect to population structure.
Panels show the distribution of PCs (principal components of the genotype data) for the siblings and unrelated sets used in the analysis described for Figure 3 of the main text. For each sibling pair, one sibling was randomly selected for these comparisons. The asterisk symbol marks a significant difference at the 1% level between siblings and unrelated individuals, as assessed by a Mann-Whitney test. Despite slight but significant differences, siblings and unrelated sets are broadly similar with respect to their genetic ancestries.

