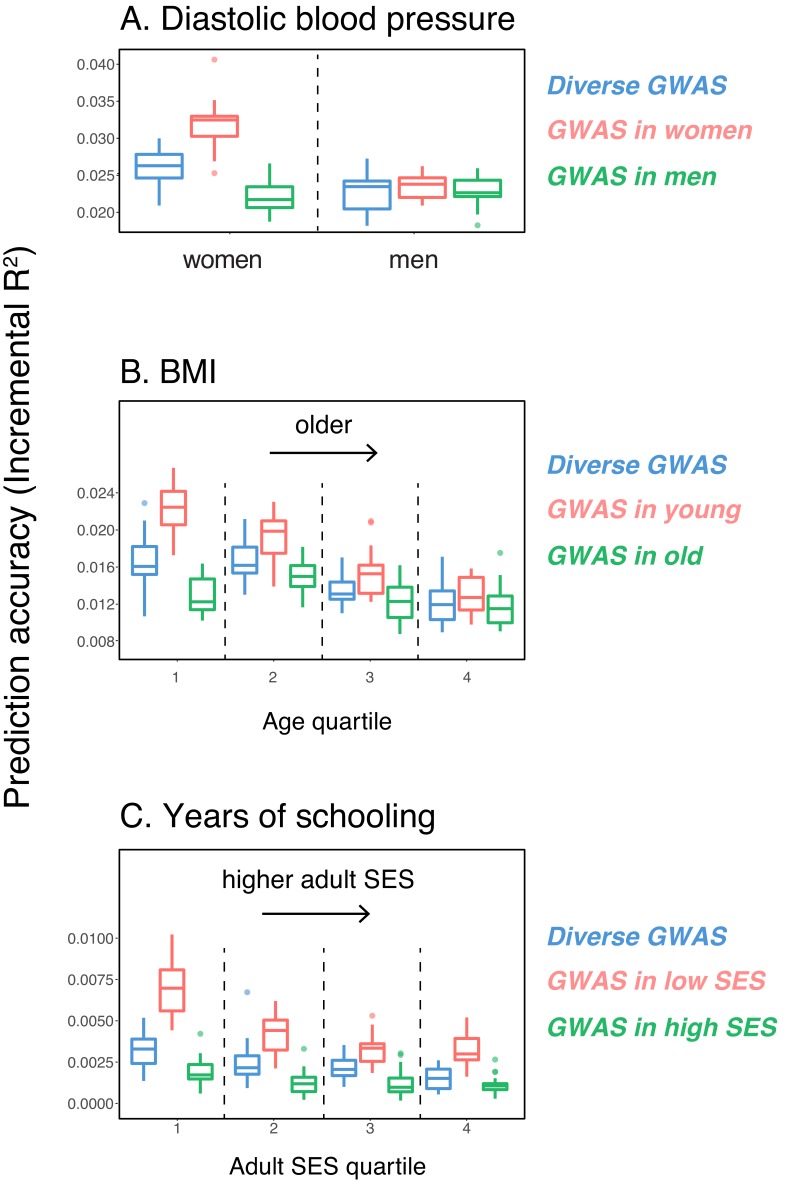
Figure 1. Variable prediction accuracy of polygenic scores within an ancestry group.
Shown are incremental values (i.e., the increment in obtained by adding a polygenic score predictor to a model with covariates alone) in different prediction sets. Each box and whiskers plot is computed based on 20 iterations of resampling GWAS and prediction sets. Thick horizontal lines denote the medians. The polygenic scores were estimated in samples of unrelated WB individuals. Phenotypes were then predicted in distinct samples of unrelated WB individuals, stratified by sex (A), age (B) or Townsend deprivation index, a measure of SES (C). In red and green cases, polygenic scores are based on a GWAS in a sample limited to one sex, age or SES group (a 'stratum'). In blue, polygenic scores are based on a GWAS in a diverse sample matching the number of individuals in each stratum. GWAS samples sizes are: 122,774 for all three diastolic blood pressure GWAS samples, 72,328 for all three BMI GWAS samples, 73,280 for years of schooling GWAS in the diverse sample and 73,283 for GWAS in the low SES and high SES samples.

