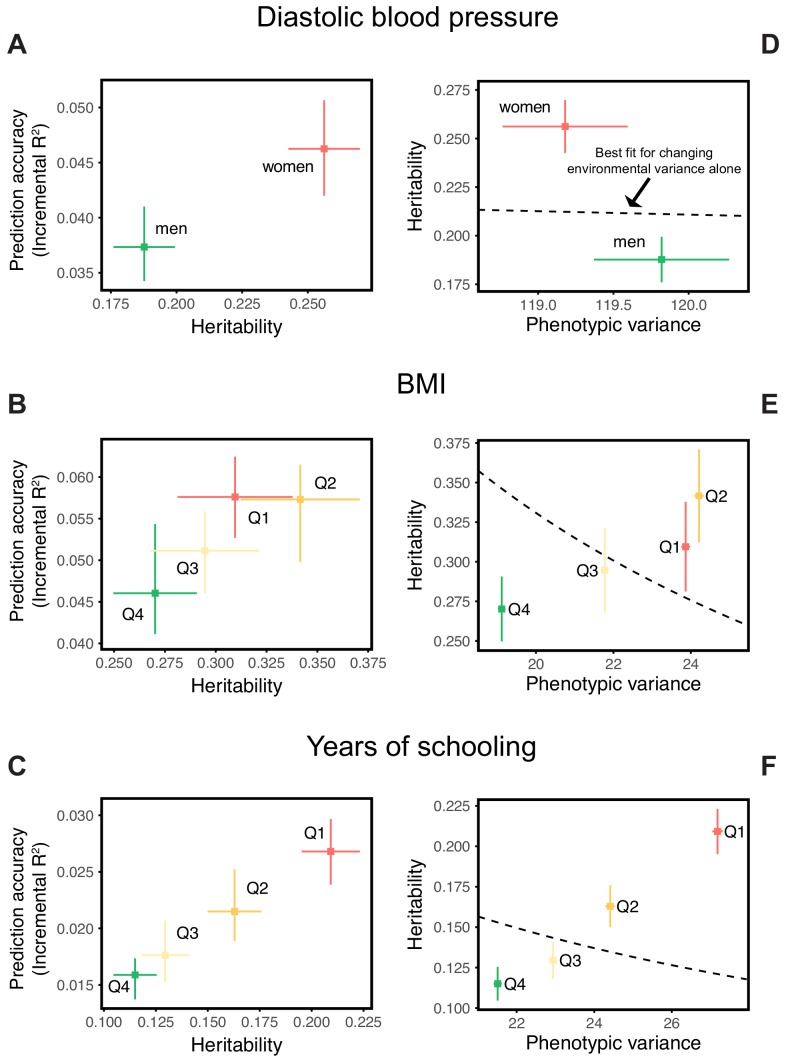
Figure 2. Differences in environmental variance alone do not explain the variable prediction accuracy.
(A,B,C) The x-axes show heritability estimates (± SE) based on LD score regression in each set. The y-axes show incremental values obtained using the procedure described in Figure 1, with GWAS performed in a pooled sample of all strata and testing in stratified prediction sets (see Materials and methods); points and bars show mean and central 80% range computed based on 20 iterations of resampling GWAS and prediction sets. ‘Q’ denotes quartile of age and SES in (B,E) and (C,F), respectively. (D,E,F) The x-axes show phenotypic variance estimates (± SE) across strata after adjusting for covariates (sex, age and 20 PCs). If the heritability differences across strata are due to differences in environmental variance alone, with genetic variance constant, then heritability should be inversely proportional to phenotypic variance. The best-fitting model for this inverse proportionality (dashed line, simple linear regression) provides a poor fit to the observations.

