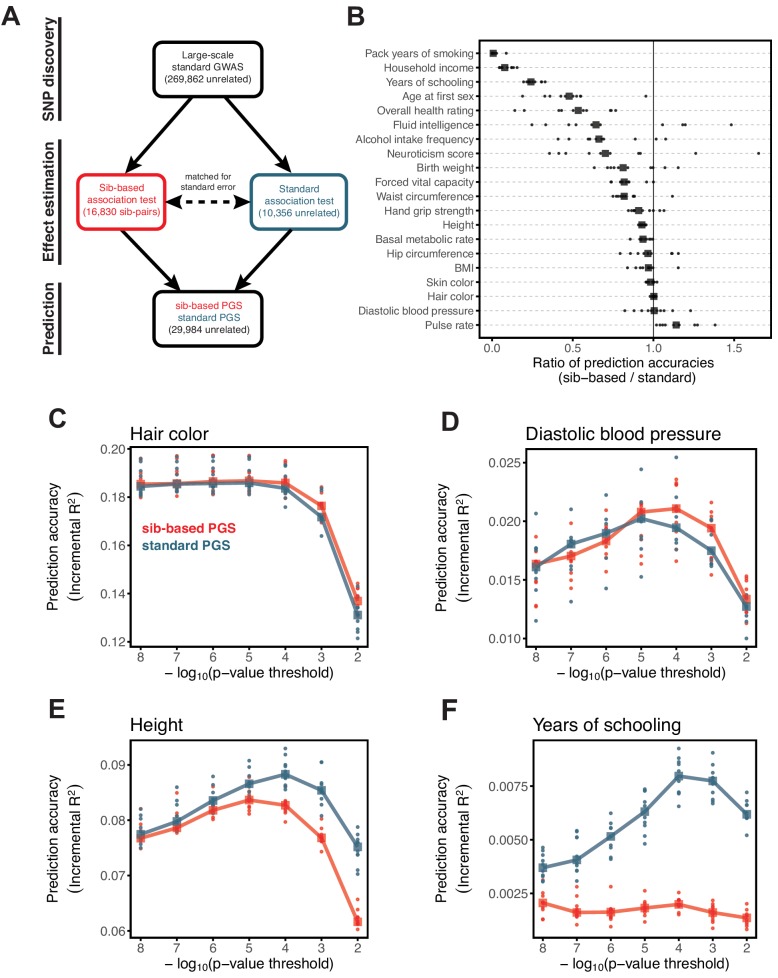
Figure 3. Comparison of prediction accuracy of standard and sib-based polygenic scores.
(A) After ascertaining SNPs in a large sample of unrelated individuals, we estimated the effects of these SNPs with a standard regression using unrelated individuals and, independently, using sib-regression. We then used the polygenic scores for prediction in a third sample of unrelated individuals. We chose the sample size of the standard PGS estimation set such that median effect estimate SEs are equal in the two designs, thereby ensuring equal prediction accuracy under a vanilla model with no indirect effects or assortative mating. Numbers in parentheses are median sample size in each set across 20 traits (see Materials and methods and Appendix 1—table 1 for the definition of each trait, and Appendix 1—table 3 for sample sizes for each trait). (B) Ratio of prediction accuracy in the two designs across 20 traits. For each trait, we performed 10 resampling iterations of unrelated individuals into three sets for discovery, estimation and prediction (small points). Large points show median values. (C-F) We repeated this procedure with different discovery-set p-value thresholds for including a SNP in the polygenic score. The higher the p-value threshold is, the more SNPs are included. For each p-value threshold, points show 10 iterations as described and large points show median values. Shown are a subset of traits, with traits appearing in (B) but not shown here presented in Appendix 1—figure 12.

