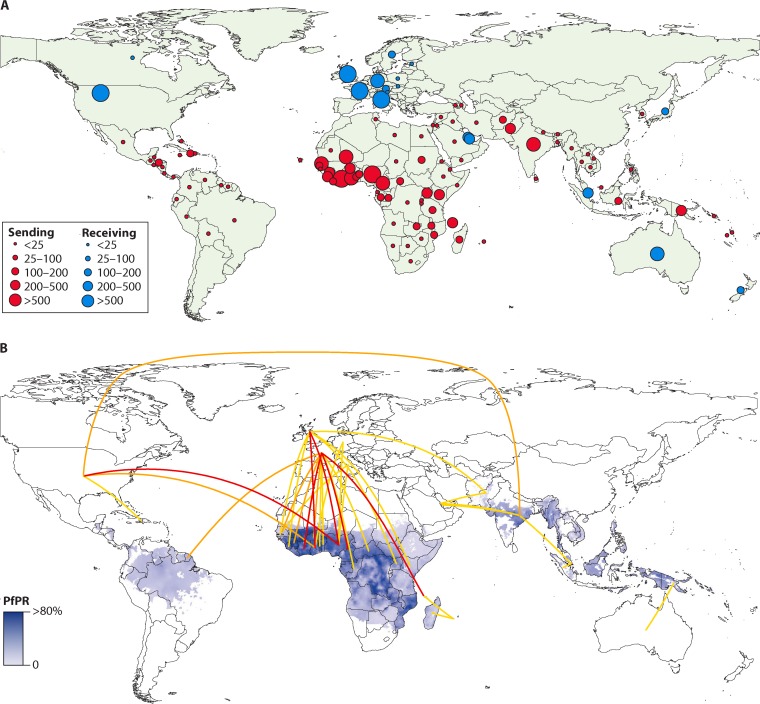
FIG 1.
Number and movement of imported and exported cases of malaria between 2005 and 2015. (A) Average annual number of malaria cases (all species) exported from endemic to nonendemic countries (red) and imported to nonendemic from endemic countries (blue). (B) P. falciparum prevalence overlaid with flow lines showing country connectivity by average annual flows of >50 (>200 [red], 100 to 200 [orange], and 50 to 100 [yellow]) cases. (Reproduced from reference 8.)

