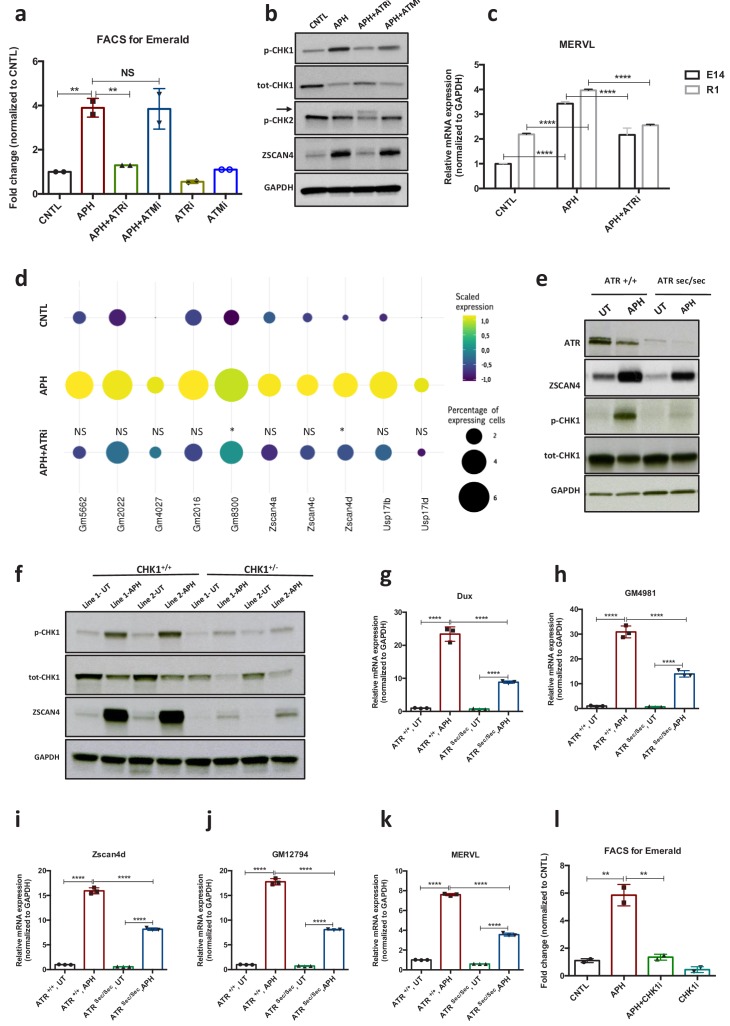
Figure 2. ATR and CHK1-mediated RSR triggers activation of key 2C-specific genes in ESCs.
(a) FACS analysis on pZscan4-Emerald ESCs showing the number of Em+ cells upon treatment with APH and specific ATR and ATM inhibitors. (b) Immunoblot for the phosphorylation status of key DDR kinases (CHK1 and CHK2) and the ZSCAN4 protein level upon treatment with APH and ATM/ATR inhibitor in ESCs. (c) RT-qPCR analysis of two ESCs lines for the expression of MERVL upon treatment with APH and ATRi. (d) Plot showing the scaled expression of 2C-specific markers and the percentage of cells expressing 2C-related genes in CNTL, APH-treated and APH+ATRi conditions. Fisher's exact test was used to determine p-values. (e) Immunoblot for ZSCAN4, ATR and the phosphorylation status of CHK1 upon APH treatment of AtrSec/Sec and Atr+/+ ESCs. (f) Immunoblot showing the expression of ZSCAN4 and p-CHK1 in Chk1+/- and Chk1+/+ ESCs upon treatment with APH. (g–k) RT-qPCR for 2C-specific genes in AtrSec/Sec and Atr+/+ ESCs treated with APH. (l) FACS analysis of pZscan4-Emerald ESCs showing the number of Em+ cells upon treatment with APH and a specific CHK1 inhibitor. Statistical significance compared to CNTL unless otherwise indicated. All bar plots show mean with ± SD (*p≤0.05, **p≤0.01, ***p≤0.001, ****p≤0.0001, one-way ANOVA). For western blots quantification refer to Figure 2—source data 1.


