. 2020 Mar 12;9:e54756. doi: 10.7554/eLife.54756

Figure 3. ATR induces transcriptional signature of 2C-like cells in ESCs.

(a) MA plot showing gene expression in ESCs treated with APH in comparison to control. Key 2C-specific genes are highlighted (b) MA plot showing retrotransposons expression upon APH treatment. (c) Heatmap showing the robust z-scores for 2C-specific genes in the indicated samples. 2C-related genes were identified by performing a differential expression analysis on ZSCAN4+/MERVL+v.s. ZSCAN4-/ MERVL- ESCs from Eckersley-Maslin et al. (2016). (d) Bar plot displaying the percentage of ATR-dependent differentially expressed genes among the ones shared between APH-treated ESCs and each dataset. (e–g) RT-qPCR analysis of Dux KD ESCs for Dux and Zscan4d genes, and MERVL upon treatment with APH. (h) Immunoblot for p-CHK1 and ZSCAN4 proteins upon treatment with APH in Dux KD ESCs in comparison with control ESCs. Statistical significance compared to CNTL unless otherwise indicated. All bar plots show mean with ± SD (*p≤0.05, **p≤0.01, ***p≤0.001, ****p≤0.0001, one-way ANOVA). For western blots quantification refer to Figure 3—source data 1.

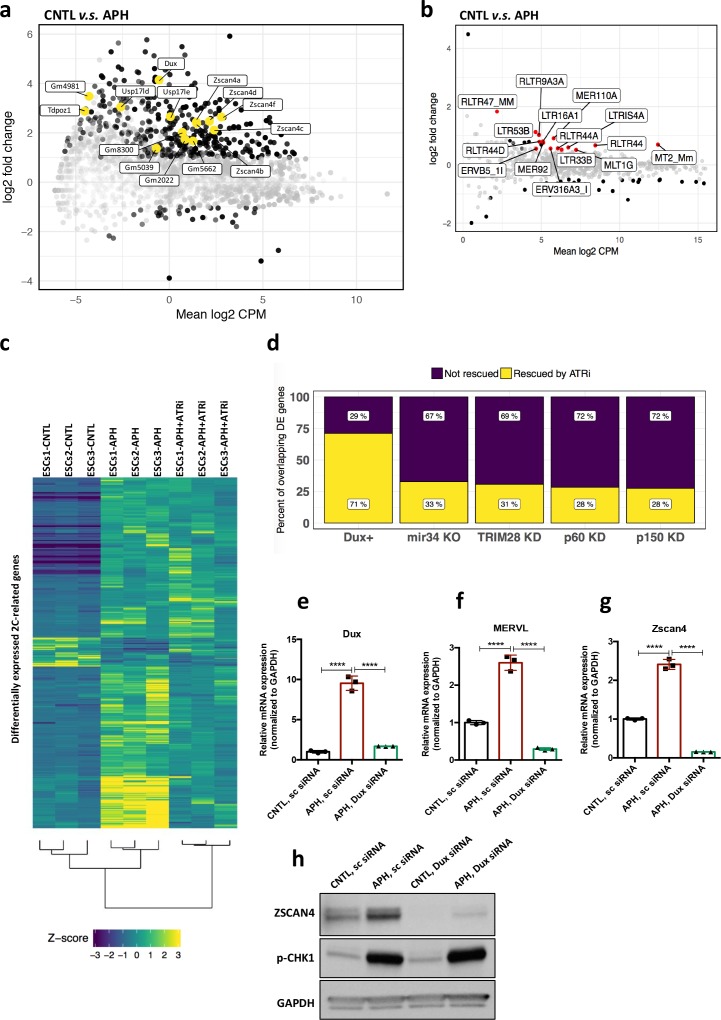
Figure 3—source data 1. qPCR and Western quantification.
elife-54756-fig3-data1.xlsx (356.9KB, xlsx)

Figure 3.

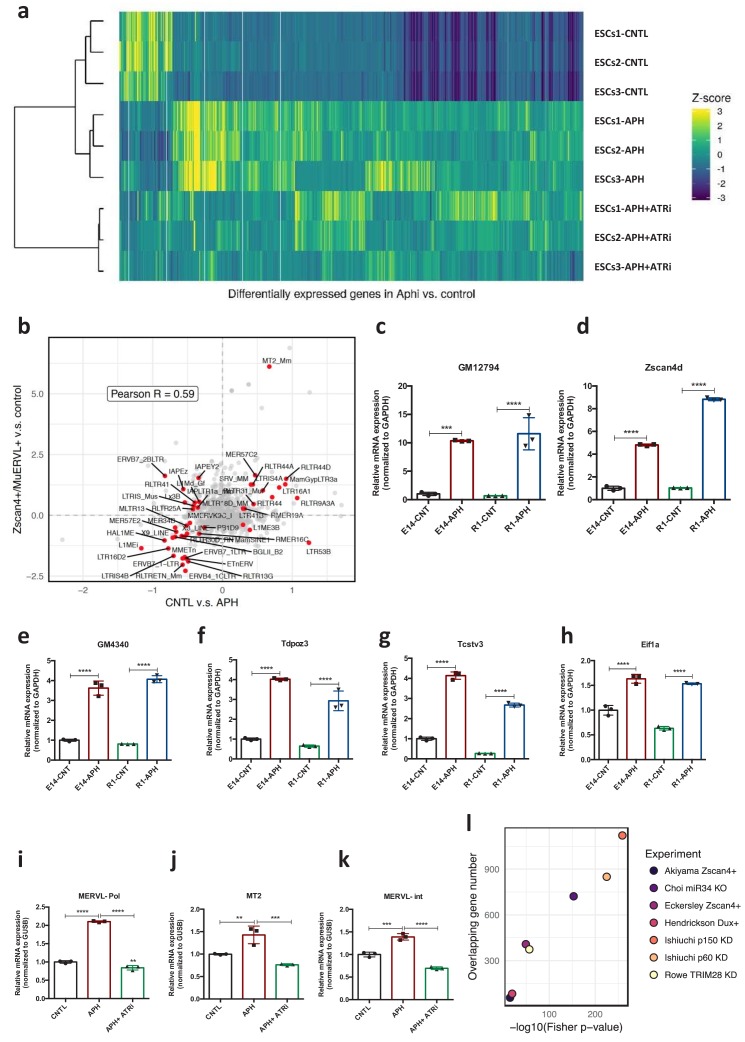
Figure 3—figure supplement 1. ATR induces transcriptional signature of 2C-like cells in ESCs.

Figure 3—figure supplement 1.

(a) Heatmap showing the robust z-scores for all the DEGs in three ESCs lines upon treatment with APH or APH+ATRi. (b) Plot showing the repeat subfamilies that are significantly differentially expressed both in our data (CNTL v.s. APH) and the ZSCAN4+/MERVL+ v.s. ZSCAN4-/MERVL- comparison (Eckersley-Maslin et al., 2016). The Pearson correlation (0.59) between the log2 fold changes from the two comparisons is also shown on the plot. (c–h) Validation of RNA-Seq results by RT-qPCR analysis. (i–k) RT-qPCR analysis of ESCs for expression of MERVL elements upon treatment with APH and ATRi (l) Plot shows the number of genes expressed in ESCs upon treatment with APH overlapping with previously published datasets. The -log10 (Fisher p-value) shows the significance of overlaps obtained from Fisher test. Statistical significance compared to CNTL unless otherwise indicated. All bar plots show mean with ± SD (*p≤0.05, **p≤0.01, ***p≤0.001, ****p≤0.0001, one-way ANOVA).
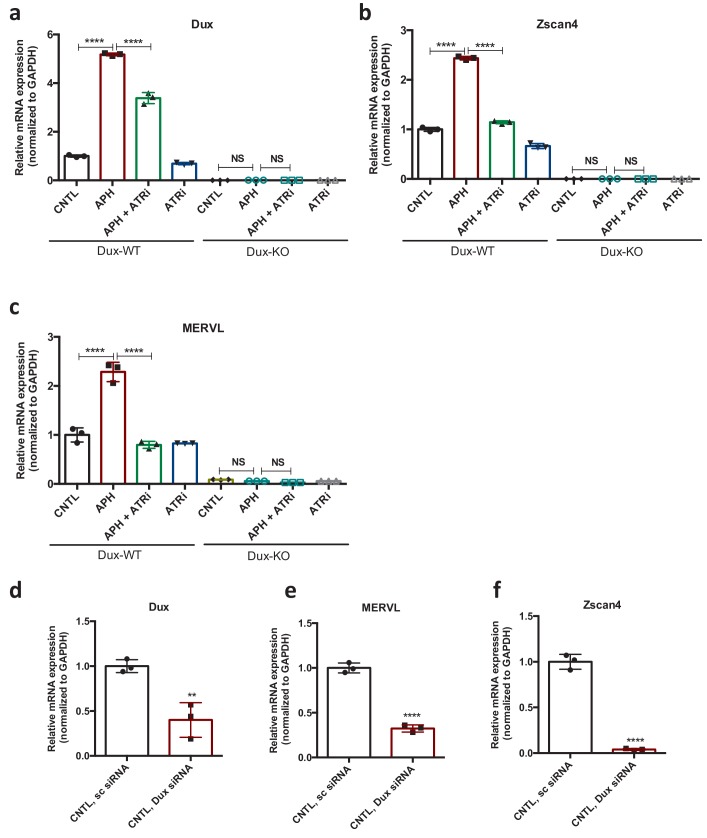
Figure 3—figure supplement 2. ATR induces transcriptional signature of 2C-like cells in ESCs.

Figure 3—figure supplement 2.

(a–c) RT-qPCR analysis for Dux, Zscan4, and MERVL expression upon treatment with APH and ATRi in Dux KO and WT ESCs. (d-f) RT-qPCR analysis of ESCs for expression of 2C-like genes in siRNA-mediated Dux KD ESCs compared to CNTL ESCs treated with sc siRNA. Statistical significance compared to CNTL unless otherwise indicated. All bar plots show mean with ± SD (*p≤0.05, **p≤0.01, ***p≤0.001, ****p≤0.0001, one-way ANOVA).