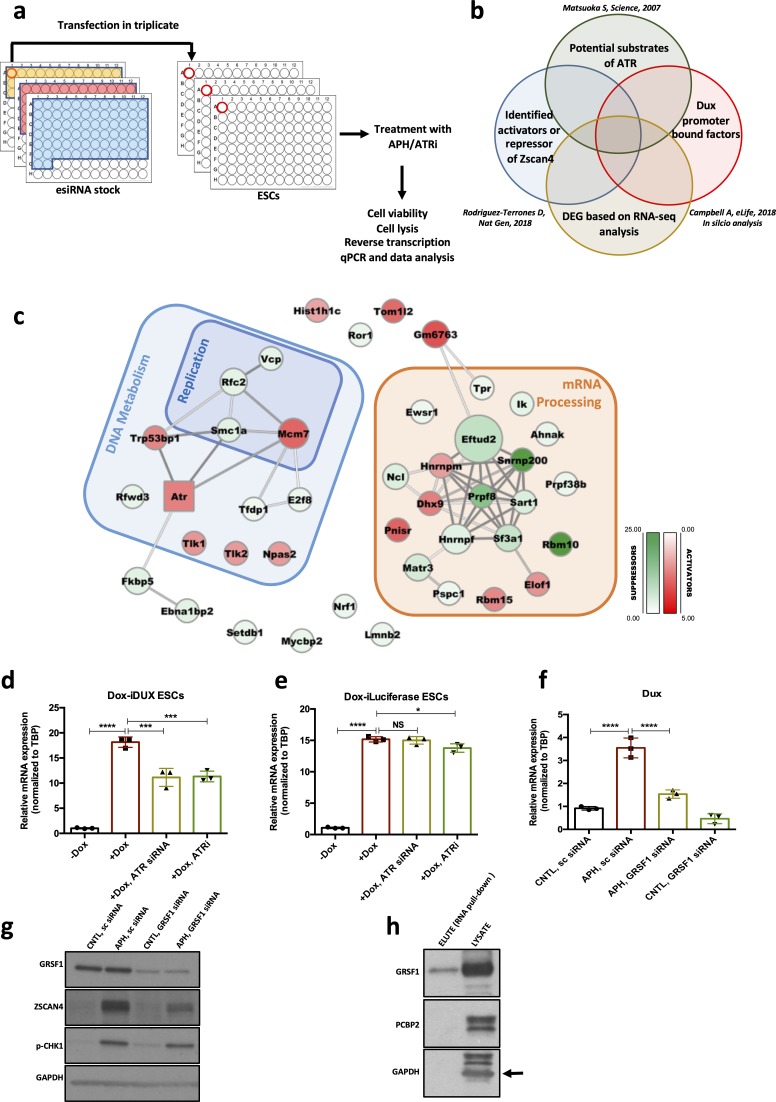
Figure 5. Identification of RSR downstream molecular players regulating the 2C-like state.
(a.b) Schematic design of the esiRNA-based knock-down screening and esiRNA library selection. (c) Protein interaction network for the hits identified through the esiRNA screening. Activators and suppressors are highlighted in red and green, respectively. The interactions are based on the STRING database. (d) RT-qPCR analysis of iDox-Dux ESCs for exogenous Dux mRNA upon treatment with Dox. (e) RT-qPCR analysis of iDox-Luciferase ESCs for Luciferase mRNA upon treatment with Dox. (f) RT-qPCR analysis of Dux mRNA upon APH treatment and Grsf1 KD. (g) Immunoblot showing the expression of GRSF1, ZSCAN4 and pCHK1 upon Gsrf1 KD. (h) Immunoblot showing the binding of GRSF1 protein to the Dux mRNA. Statistical significance compared to CNTL unless otherwise indicated. All bar plots show mean with ± SD (*p≤0.05, **p≤0.01, ***p≤0.001, ****p≤0.0001, one-way ANOVA). For western blots quantification refer to Figure 5—source data 1.


