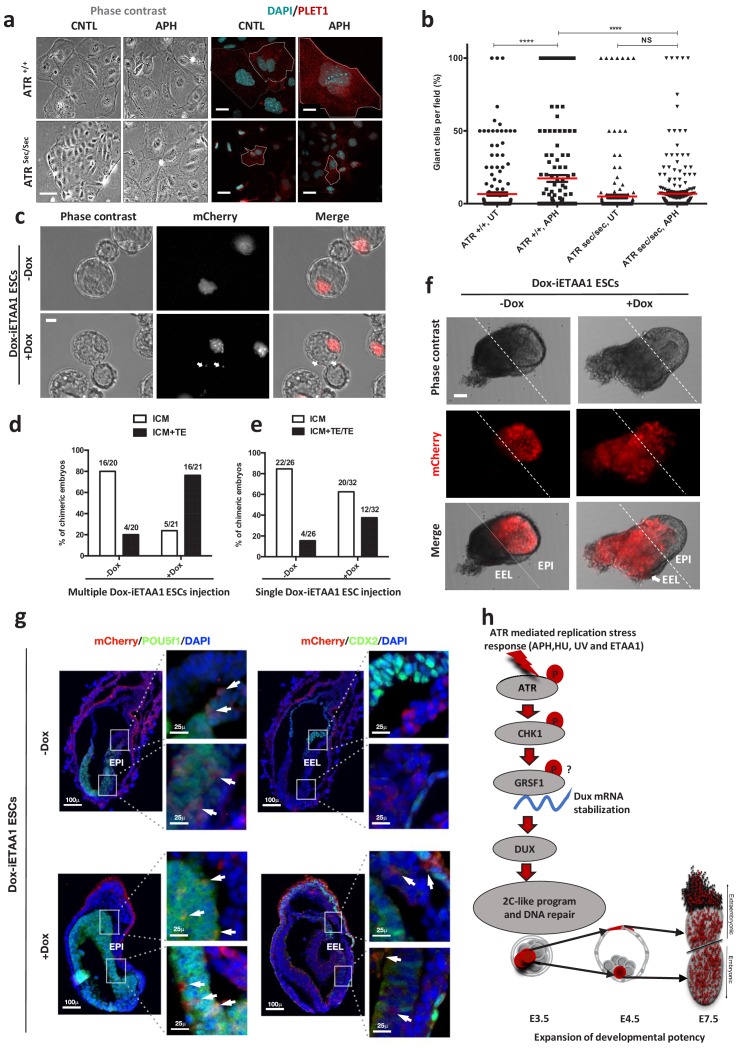
Figure 6. ATR-activated 2C-like cells gain expanded developmental potential in vitro and in vivo.
(a) Phase contrast and immunofluorescence images of TGCs formed by in vitro differentiation of Atr+/+ or Atrsec/sec ESCs treated with or without APH (bar = 25 µm). (b) Quantification of the number of TGCs detected in the conditions represented in a. (c) Images of blastocysts displaying the contribution of mCherry-labeled Dox-iETAA1 ESCs to the ICM and TE layers in the presence and absence of Dox (bar = 20 µm). (d) Bar plot showing the percentage of chimeric embryos in which injected mCherry-labeled Dox-iETAA1 ESCs could contribute to either ICM or ICM+TE with or without Dox. The ratios on top of each bar show the actual number of embryos that were analyzed. (e) Bar plot showing the percentage of chimeric embryos in which single-cell injection of mCherry-labeled Dox-iETAA1 ESCs could contribute to either ICM or ICM+TE/TE with or without Dox. The ratios on top of each bar show the actual number of embryos that were analyzed. (f) Images showing the contribution of injected mCherry-labeled Dox-iETAA1 ESCs to the epiblast (EPI) or extra-embryonic layers (EEL) of mouse embryos at E7.5 with or without Dox treatment (bar = 50 µm). (g) Immunostaining of mouse embryos at E7.5. Arrows in the left panel indicate the contribution of mCherry-labeled Dox-iETAA1 ESCs to the EPI (marked by POU5F1) in Dox-treated and untreated conditions. Arrows in the right panel indicate the contribution of injected mCherry-labeled Dox-iETAA1 ESCs to the EEL (marked by CDX2) only in Dox-treated condition. (lower magnification, bar = 100 µm, higher magnification, bar = 25 µm). (h) Schematic model defining a novel ATR-dependent transcriptional response to maintain the genomic integrity of developing embryos in response to RS. 1) ATR and CHK1-mediated RSR triggers the Dux mRNA accumulation through GRSF1 that in turn increases bipotent 2C-like cells by global transcriptional activation of 2C-specific genes including Zscan4. 2) ATR-induced bipotent ESCs extend their contribution to placental compartment. In the dot plot the mean is represented by a red line. Statistical significance compared to CNTL unless otherwise indicated. (*p≤0.05, **p≤0.01, ***p≤0.001, ****p≤0.0001, one-way ANOVA).


