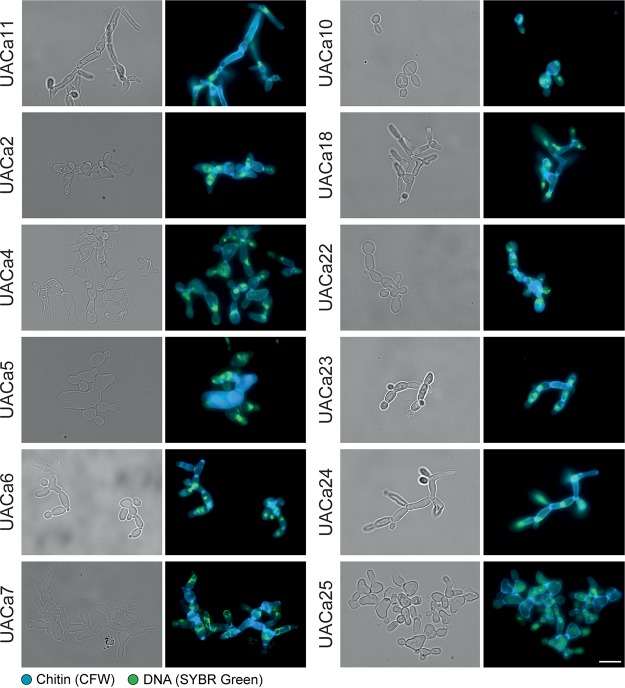
FIG 6.
Different degrees of filamentation in Candida auris clinical isolates. Representative microscopy images of selected clinical isolates (see Table S2 at https://doi.org/10.6084/m9.figshare.11378550) after growth in YPD broth containing 100 mM HU for 18 to 20 h at 30°C. Bright-field images are shown in the left columns, and merged fluorescent images (chitin stained by calcofluor white [CFW] and DNA stained by SYBR green I) are shown in the right columns. Scale bar, 10 μm.

