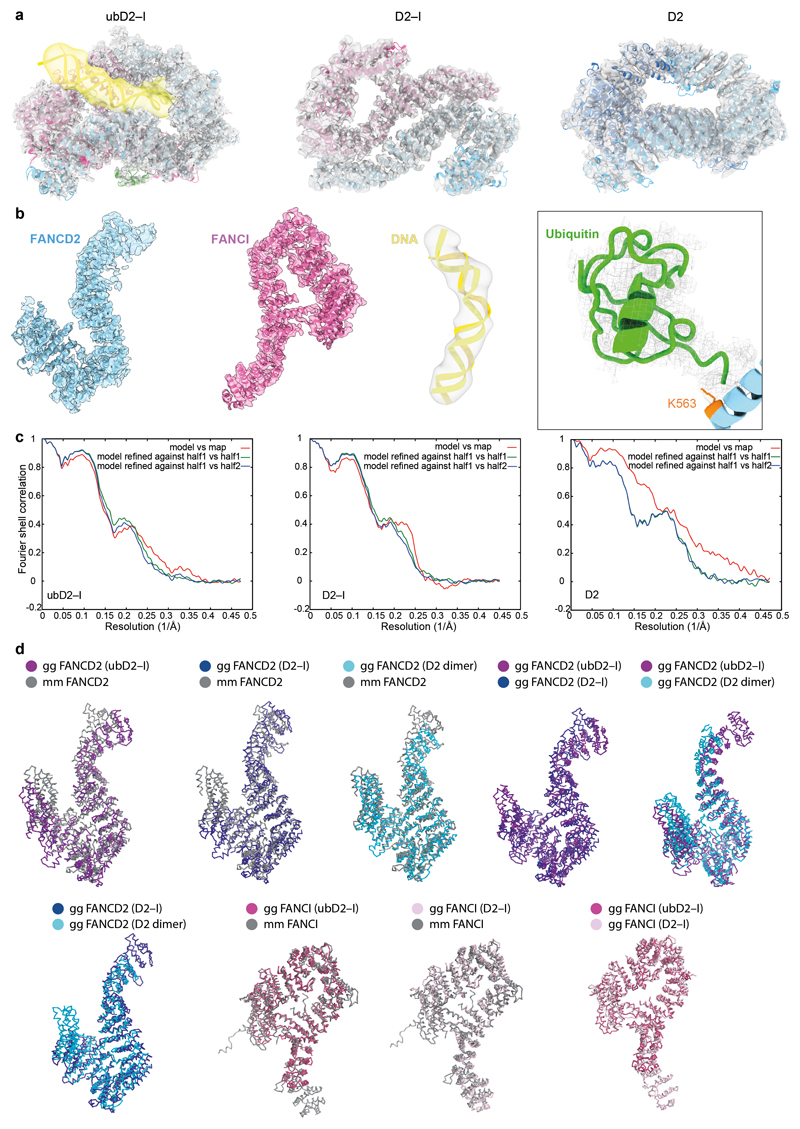
Extended Data Fig. 2. Model fitting.
a Overall fitting of model to map for ubD2–I, D2–I and D2 (FANCD2 is colored blue; FANCI magenta, ubiquitin green, and DNA yellow). b Representative fits of model to map for FANCD2, FANCI, DNA and ubiquitin in the ubD2–I structure. c FSC curves for model versus map. d FANCD2 and FANCI structures from Gallus gallus (gg) were aligned with each other and the with Mus musculus (mm)31 crystal structures using PDBeFOLD62 (http://www.ebi.ac.uk/msd-srv/ssm/) and figures were prepared with Pymol (The PyMOL Molecular Graphics System, Version 2.0, Schrödinger, LLC).

