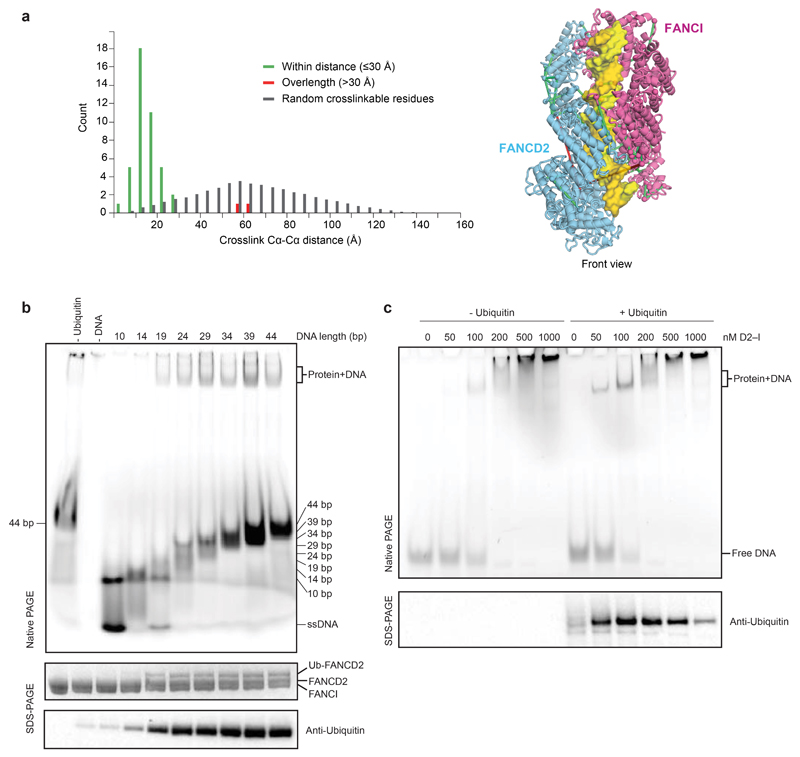
Extended Data Fig. 3. Crosslinking mass spectrometry and analysis of DNA binding by FANCD2 and FANCI.
a Distribution histogram of Cα-Cα distances between linked residue pairs in the 3D model of ubD2–I (left). Crosslinks with Cα-Cα distances below the theoretical crosslinking limit (30 Å) are shown in green. Overlength crosslinks (>30 Å) are shown in red. The distribution of Cα-Cα distances between random crosslinkable residue pairs in the 3D model is shown in grey. Crosslinks mapped onto the front view of the 3D structure are shown on the right. b Monoubiquitination assays were assembled in the presence of 5 μM linear double-stranded DNA of differing lengths (10–44 bp). DNA binding was analyzed by EMSA (top) after loading the reactions onto native gels and imaging of the fluorescently-labeled DNA. Monoubiquitination efficiency was analyzed by Coomassie blue (middle) and Western blotting the His-tagged ubiquitin (bottom). Controls lacking ubiquitin or DNA are indicated. These data are representative of experiments performed three times. c Monoubiquitination assays were assembled without (left) and with (right) ubiquitin, both in the presence of a 39 bp double-stranded DNA at 100 nM and increasing amounts of D2–I (0–1000 nM). Assays were analyzed by EMSA (top, imaging for the fluorescently-labeled DNA) or Western blotting His-tagged ubiquitin (bottom). We cannot exclude that other proteins may interact with DNA in these assays, but the migration positions of the shifted bands are similar to the experiment in Fig. 4 where ubD2–I was purified away from all other proteins. These data are representative of experiments performed three times. Uncropped images for panels b and c are available in Supplementary Fig. 1.

