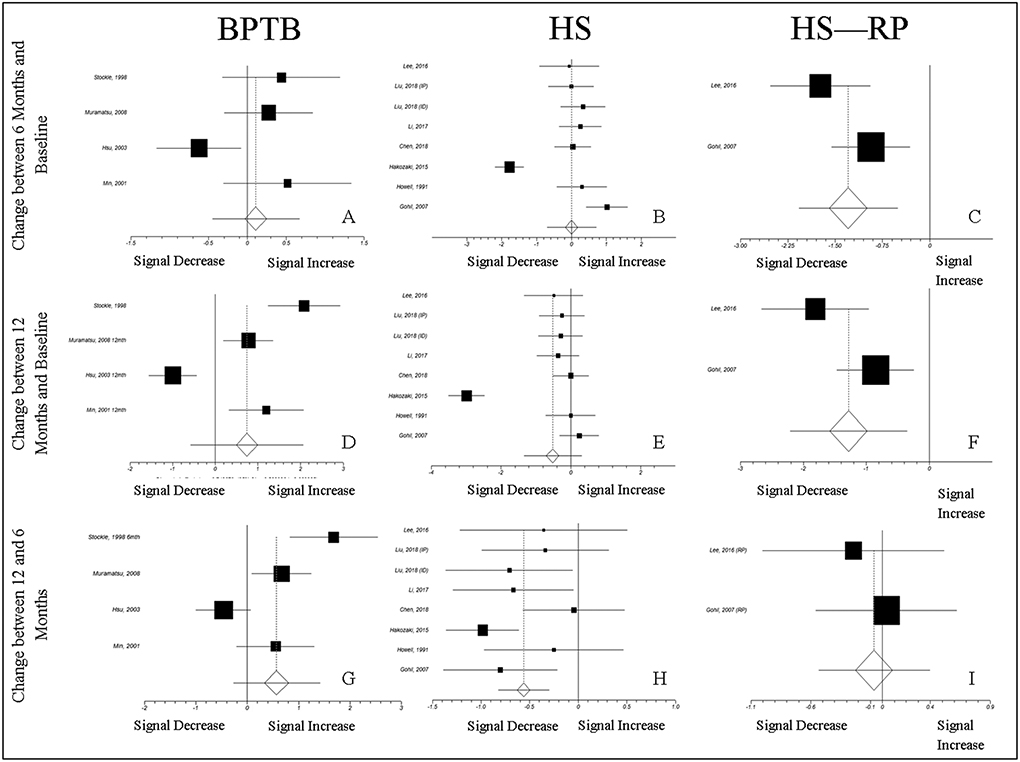
Fig. 5.
Normalized MRI Signal Intensity Effect Sizes: Changes from baseline 2 and between 6 and 12 Months. The trends in the effects of normalized MRI signal intensity parallel those predicted by the experimental model. In Panel E, the effect for the change between 12 months and baseline is not significant, while the model predicts a significant decrease in normalized MRI signal intensity for HS autografts from the ratio of 1 at 12 months (Fig. 3). The observed difference between the model and effect size calculation in this trend could be due to variability in the normalized MRI signal, accounted for in the effect size calculation, but not the 1-sample T-test used to assess predicted normalized MRI signal intensity change from baseline

