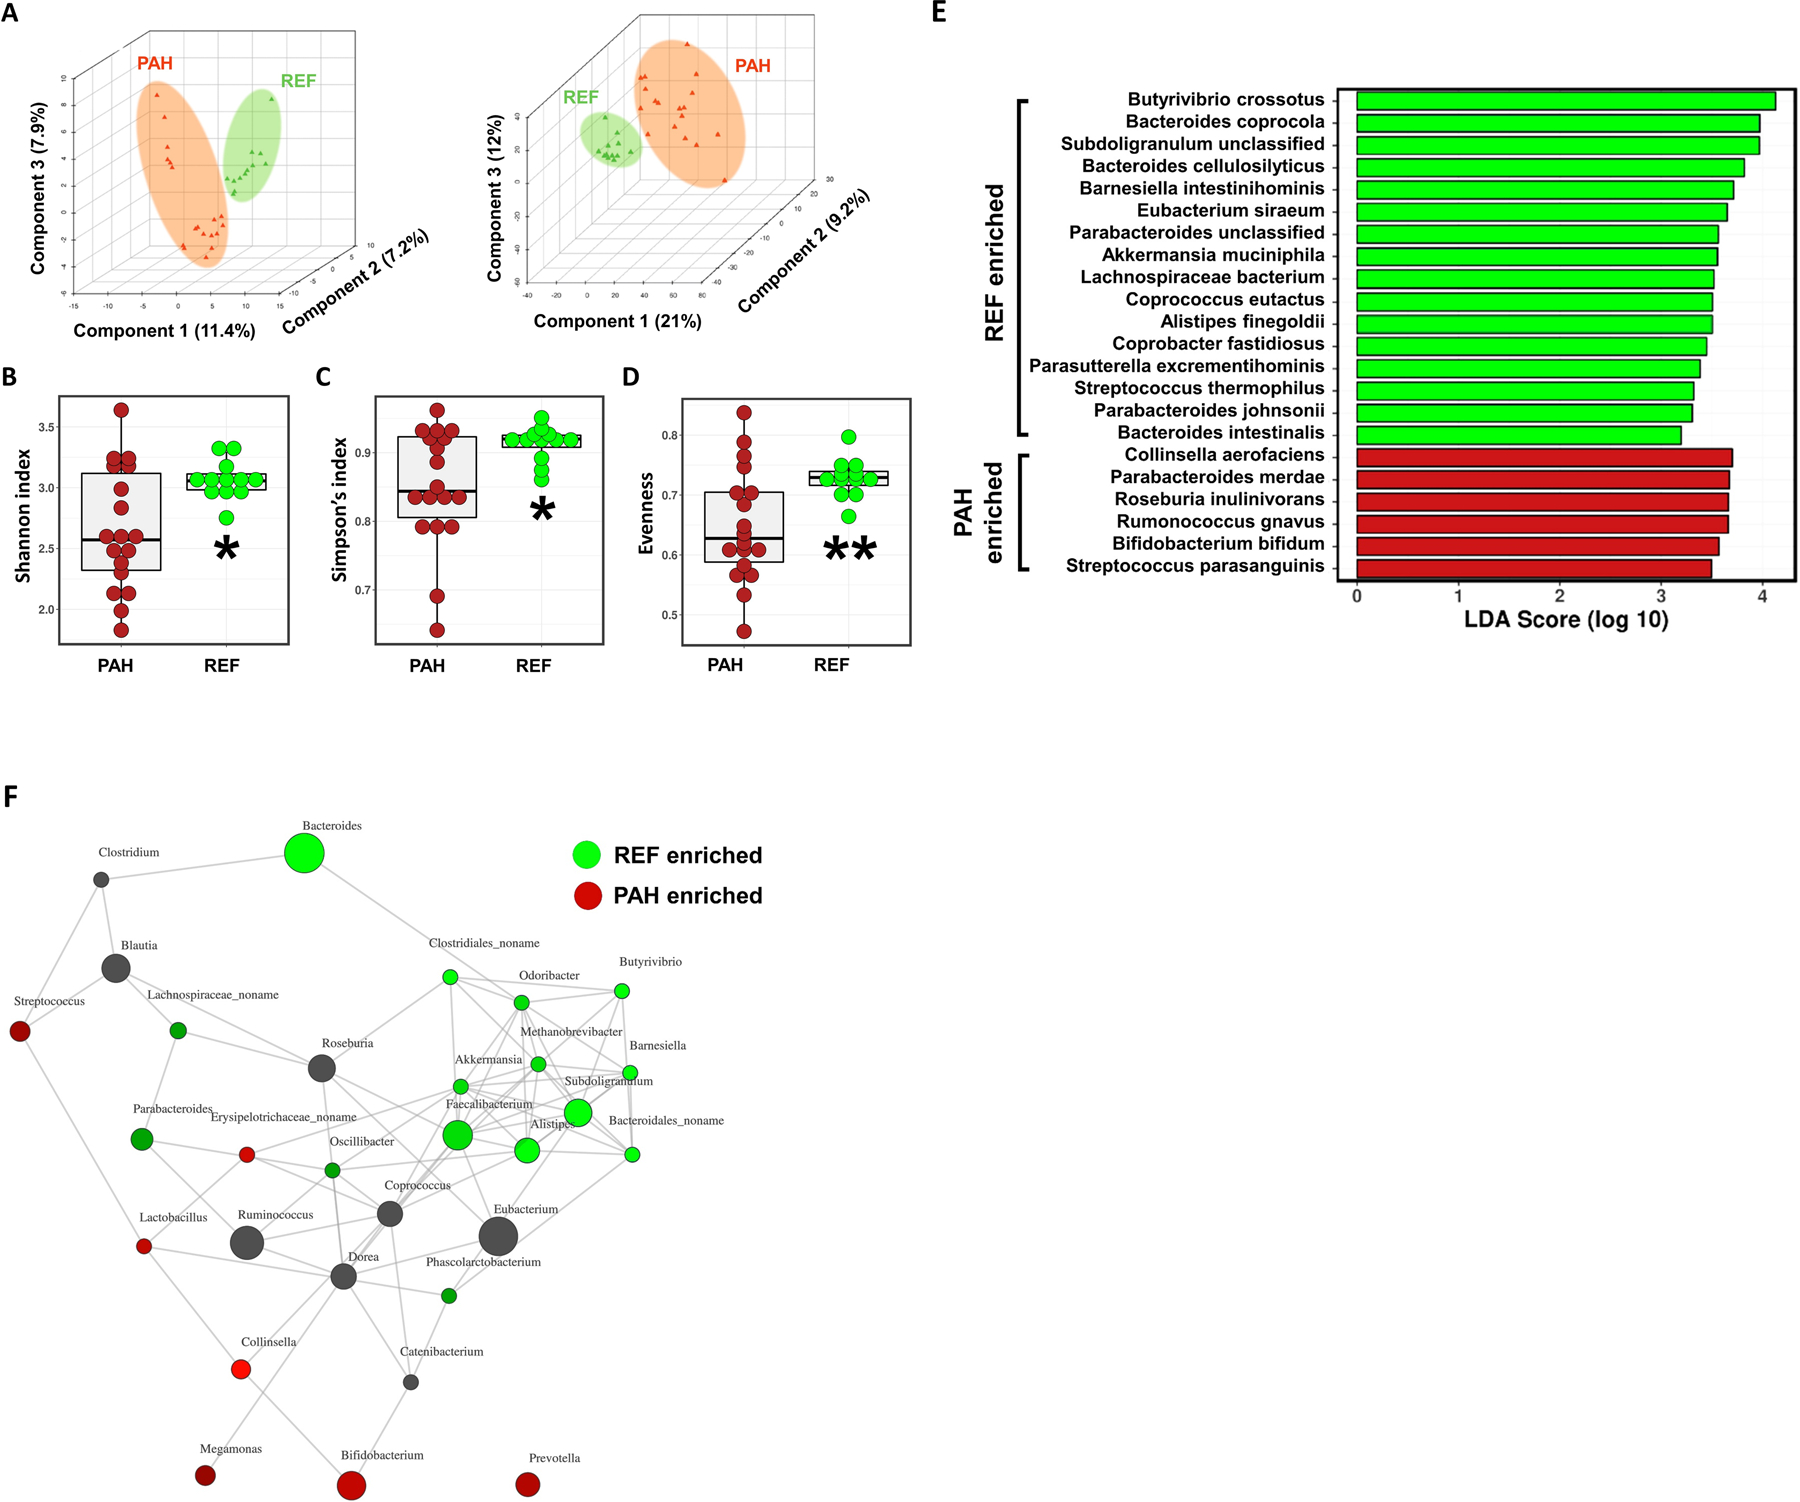
Figure 1: Altered gut microbiota composition in type 1 pulmonary arterial hypertensive patients.

(A) Partial least squares discriminant analyses (PLS-DA) were conducted to compare the overall differences in taxonomy (left) and functional gene (KEGG Orthology) profiles (right) between the reference (REF) and pulmonary arterial hypertension (PAH) cohorts. (B-D) Alpha diversity measures showed significantly reduced Shannon and Simpson indices and evenness of fecal bacterial populations of PAH patients compared to age- and gender-matched healthy REF subjects. Student’s t-test was used to compare the means of the two groups. (E) Linear discriminant analysis effect size (LEfSe) of each cohort to visualize differences in bacterial species. (F) A network plot showing positive interactions (connected lines, distance determined from the Bray-Curtis method) between genera. Genera associated with the REF cohort were marked in green, genera enriched in PAH cohort in red and neutral genera in black in the nodes.
