
Figure 2: Random forest modeling identified a subset of taxa predictive of distinguishing REF (black) and PAH (red) cohorts.
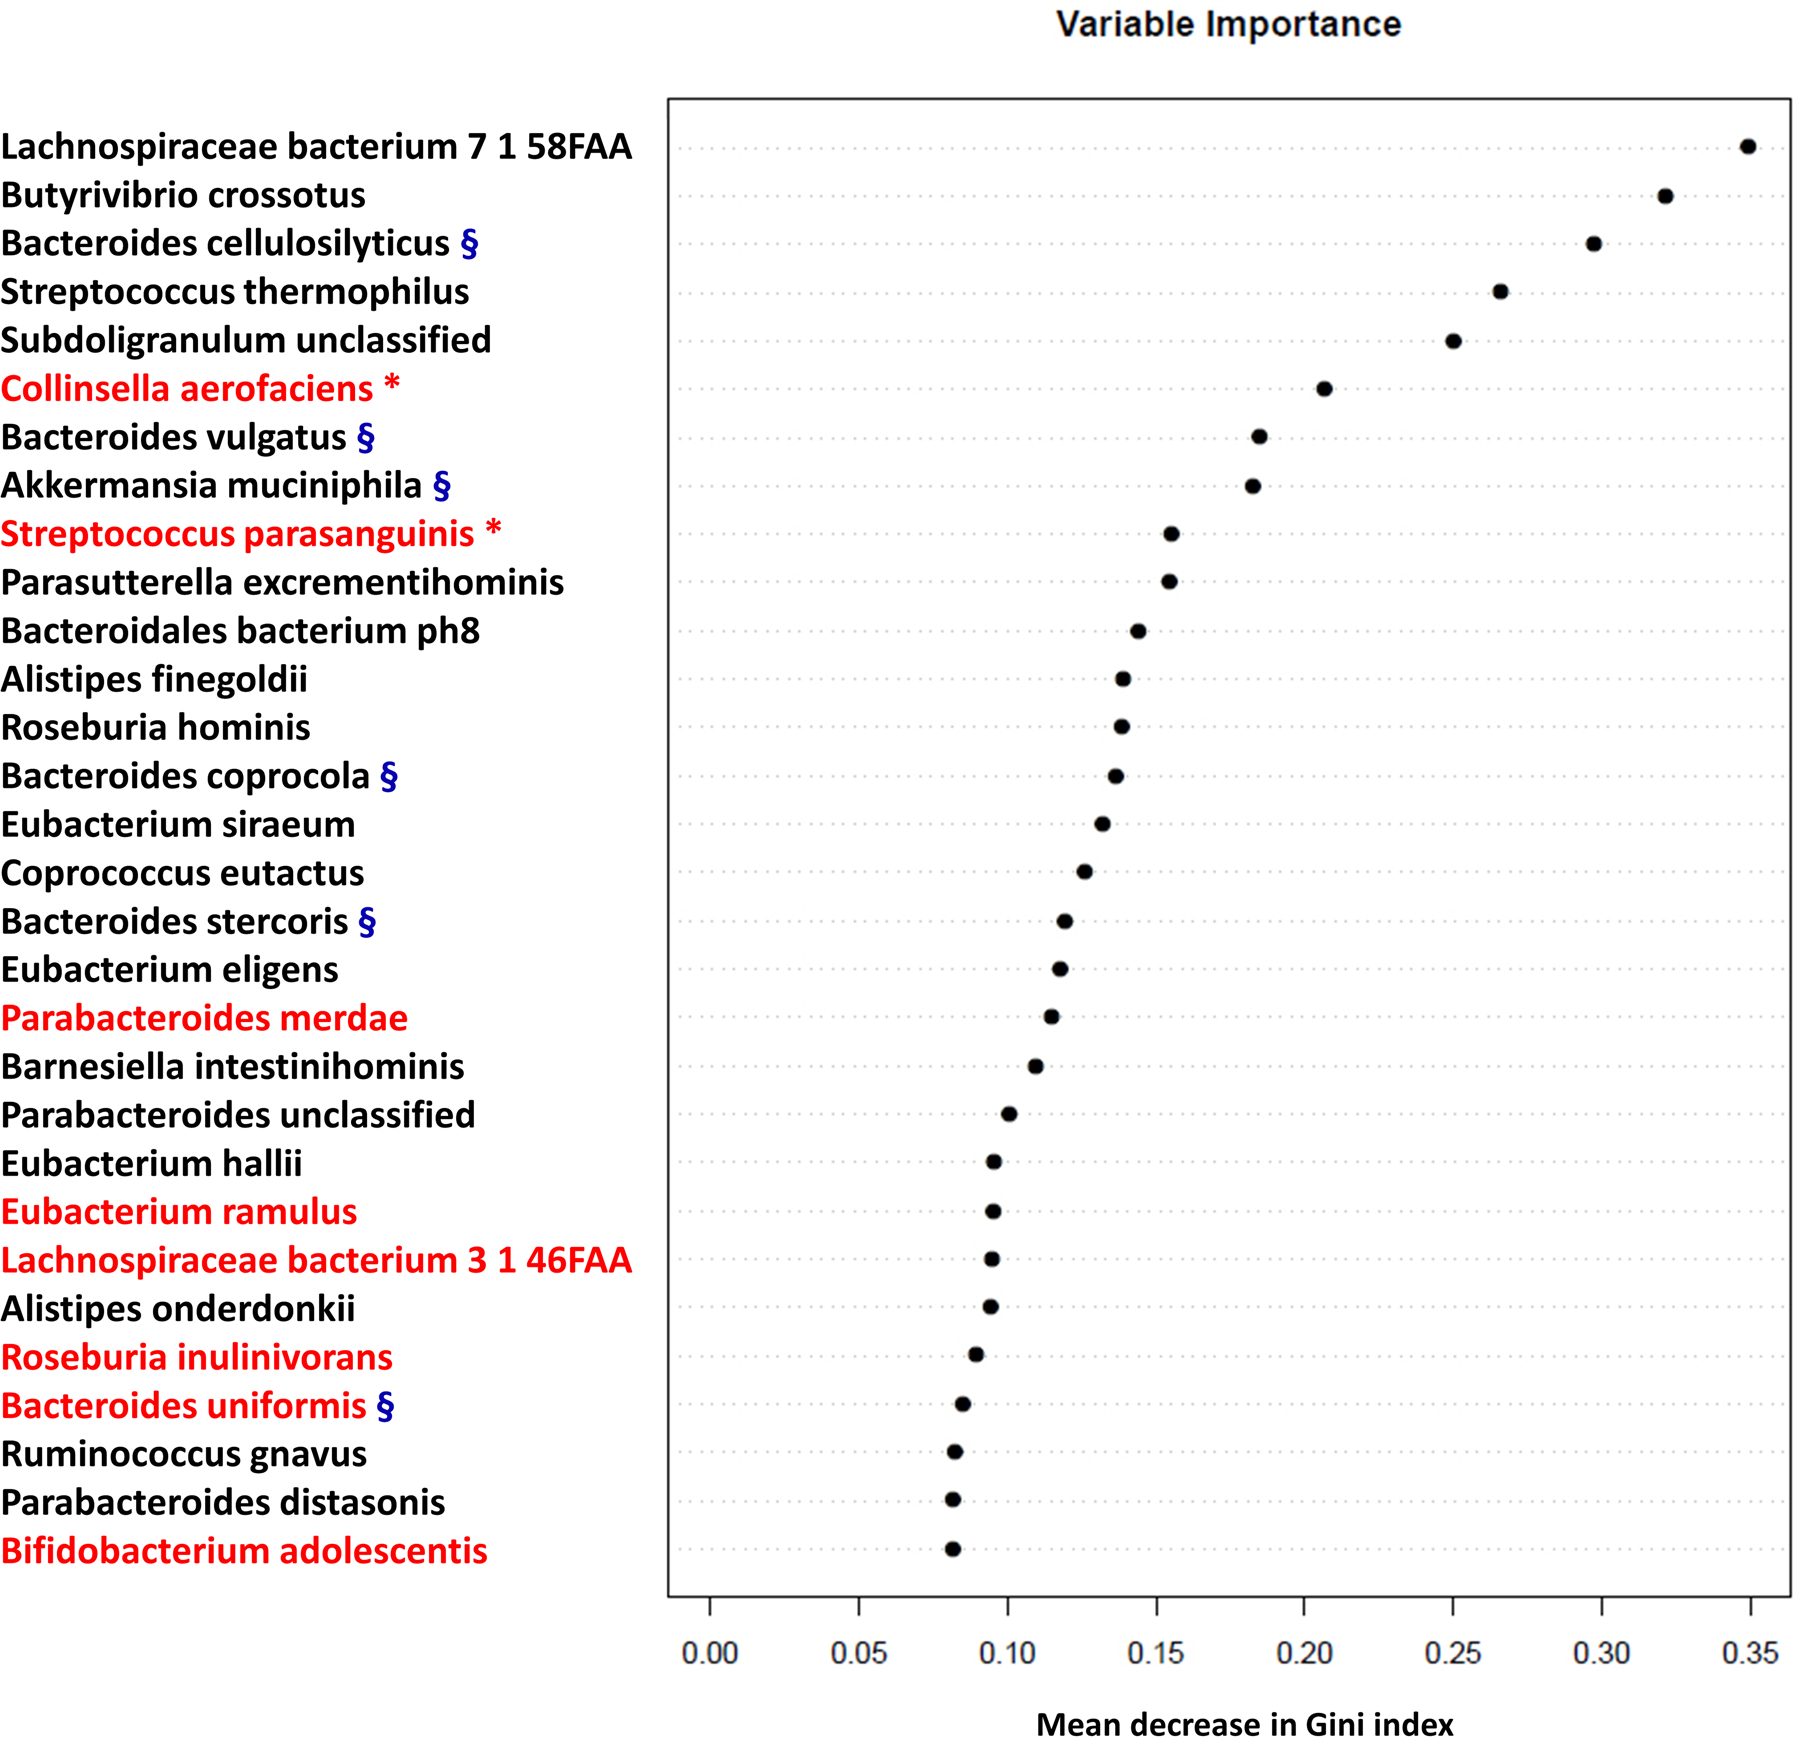
The 30 most important predictors of PAH vs. REF were ranked by Gini index determined from the random forest algorithm trained to distinguish the two cohorts. The taxa are ranked from top to bottom by decreasing Gini index scores. Since Gini index scores quantify the strength of each respective predictor, the best predictors of PAH are at the top of the plot. Bacteria with the red asterisk are positively correlated with TMA/TMAO production27. Bacteria with the blue § are negatively correlated with TMA/TMAO production28, 29.