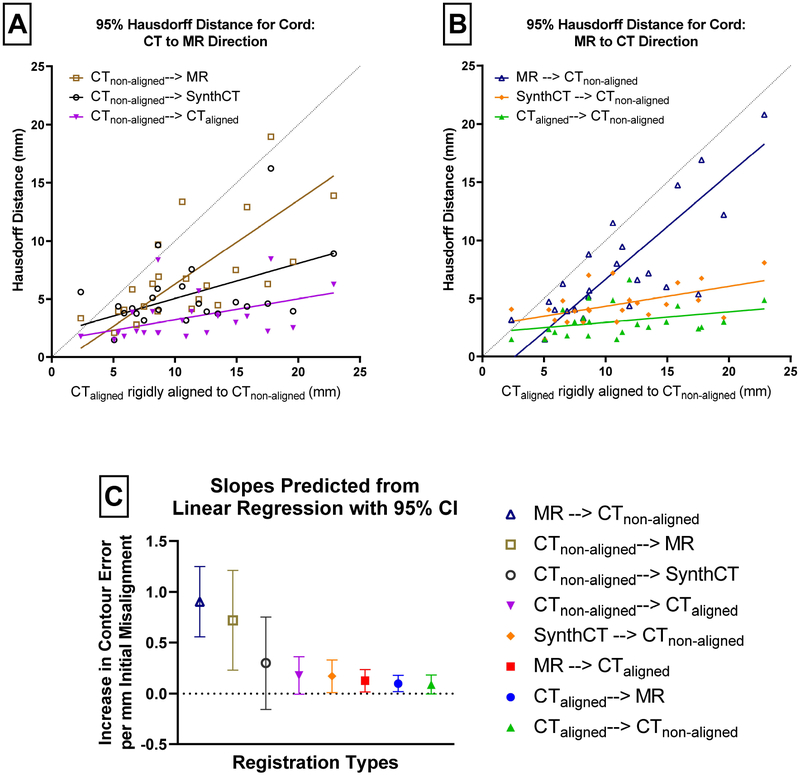
Figure 3.
The spinal cord 95% Hausdorff distance for the deformations is plotted in the top two figures as a function of the initial rigid alignment Hausdorff distance. Thus, the error in cord alignment can be evaluated in terms of how misaligned the images were initially. The diagonal line shows where the deformable image registration’s cord error would equal the initial rigid alignement’s cord error. The top figure is divided in the CT-to-MR direction on the left and the MR-to-CT direction on the right. The bottom figure shows the slopes of the best fit lines with their 95% confidence intervals.

