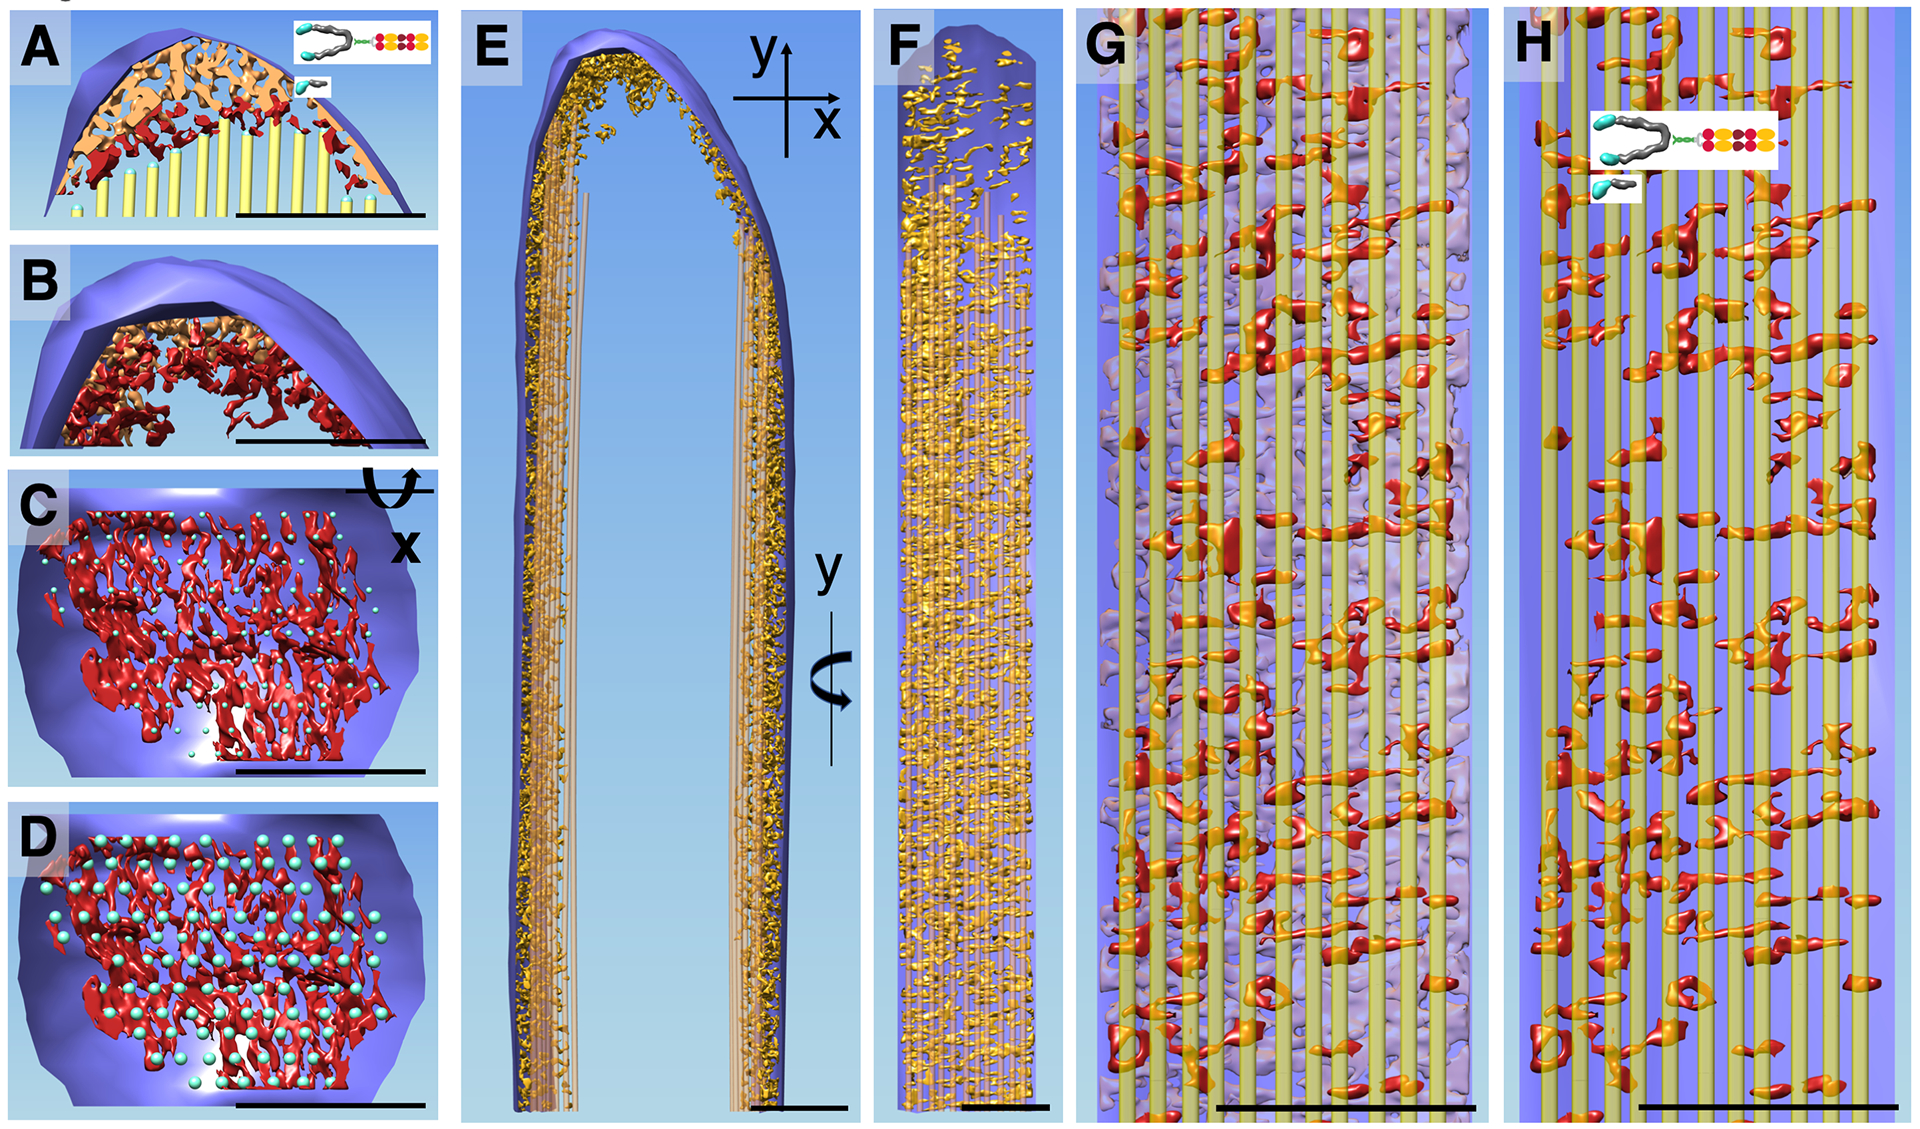
Figure 3. Actin-membrane crosslinkers in the tip and shaft regions of the Pls1−/− stereocilium model.

(A) Central density slab of the tip region with the most distal portion of the corresponding central actin-filament model layer. Note complex density near the lower tip link insertion site (left third of stereocilia tip), in stark contrast to the close proximity of the actin filament on the opposite stereocilia tip side. Red colored density rendering depicts map density within 10 nm proximity to the end of the actin filament. (B) 3D density corresponding to A. (C) En-face view onto the density map in 10 nm proximity to the actin filaments, showing a number of density lobes of similar size and what appears to be a non-random distribution. Small balls depict center location of each actin filament. (D) Same view as C but with blue balls representing the approximate actin filament diameter. Note that most but not all actin filaments show a corresponding red-colored density map. (E) Stereocilia in longitudinal orientation with the outermost layer of the actin filament of the corresponding circumferential membrane stretch of the entire stereocilia (õne third). Density between outermost actin layer and membrane is depicted in golden color. (F) Corresponding en face view of the shaft region by rotating the right portion of E by 90 degrees around the Y-axis. (G, H) Close up views of F with red density corresponding to those in close proximity (10 nm) to the outermost actin filament layer and transparent purple density corresponding to density between the red density and the membrane plane. Note that the membrane is depicted as a single plane. (H) Outermost actin layer (yellow) and red density map within 10 nm proximity to the actin filaments. Note that the red densities are similar and size, shape and orientation with the densities seen in C and D and are consistent with models of unconventional myosins. Scale bars = 100 nm
