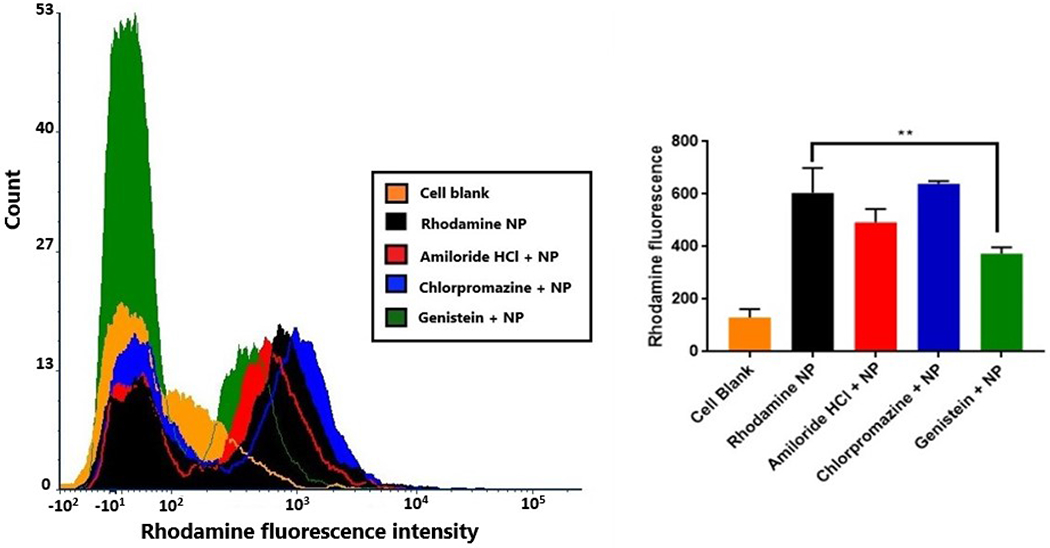
Figure 6:

Mechanism of rhodamine nanoparticle uptake in bEnd.3 cells. Flow cytometry histograms (left) are representatives of cell blank, rhodamine nanoparticles alone and with uptake inhibitor treatments. The plot (right) indicates the quantification of fluorescence intensity with respective uptake inhibitors, with genistein treatment showing significant reduction in uptake (**p<0.01).
