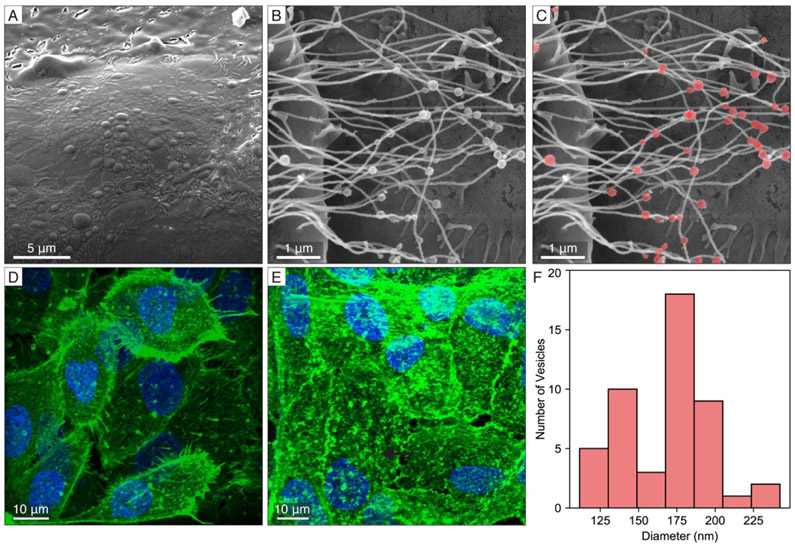
Fig. 3. Cell membrane protrusions and vesicular structures imaged by complementary techniques.
(A) Cryo-SEM of microstructure on the cell membrane of MCF10A control cells. (B) Conventional SEM image of tubular extensions from HAS3 cells containing spherical structures along their lengths as highlighted in (C). (D-E) Confocal fluorescence microscopy shows a high intensity of actin staining in HAS3 cells (E) relative to the MCF10A controls (D), consistent with the presence of numerous long tubular extensions in HAS3 cells. (F) Diameter distribution of vesicular structures along the length of membrane extensions from HAS3 cells with most vesicles being dimensionally consistent with microvesicles.

