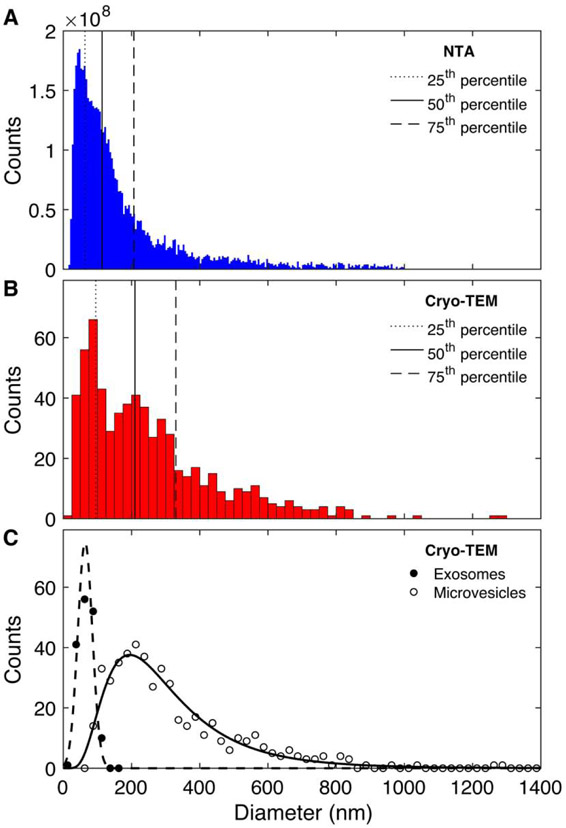
Fig. 5. HAS3 vesicle size distribution measured by NTA and cryo-TEM.
The size distribution of vesicles tracked with (A) NTA is significantly different than the distribution of vesicles observed with cryo-TEM (B). Most notably, larger vesicles comprise a greater proportion of vesicles captured by cryo-TEM than NTA. The lower throughput of cryo-TEM is reflected in the smaller number of vesicles measured (n=642). (C) Direct cryo-TEM imaging of the vesicle surface structure allows identification of two vesicle subpopulations where those with clear surface features are grouped as Microvesicles while others are labelled Exosomes. Data in (A) and (B) are replotted using the same bin size in Figure S2.

