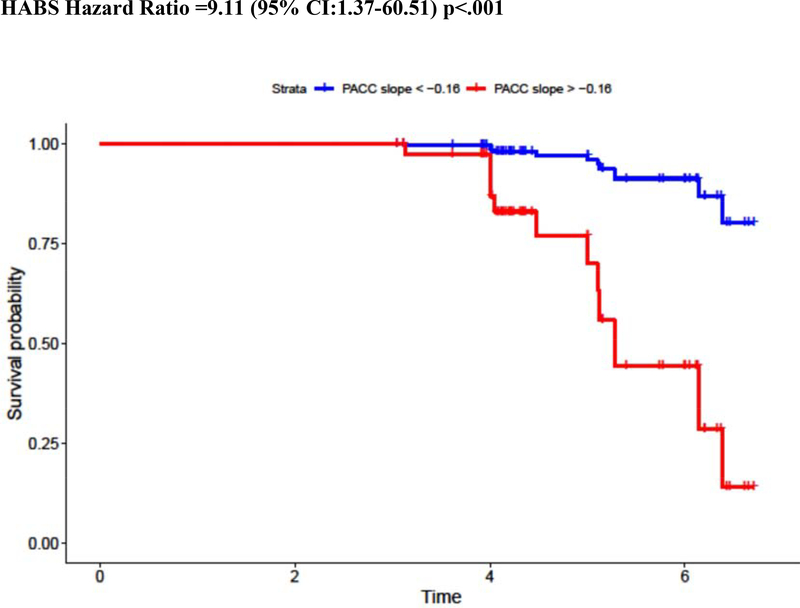
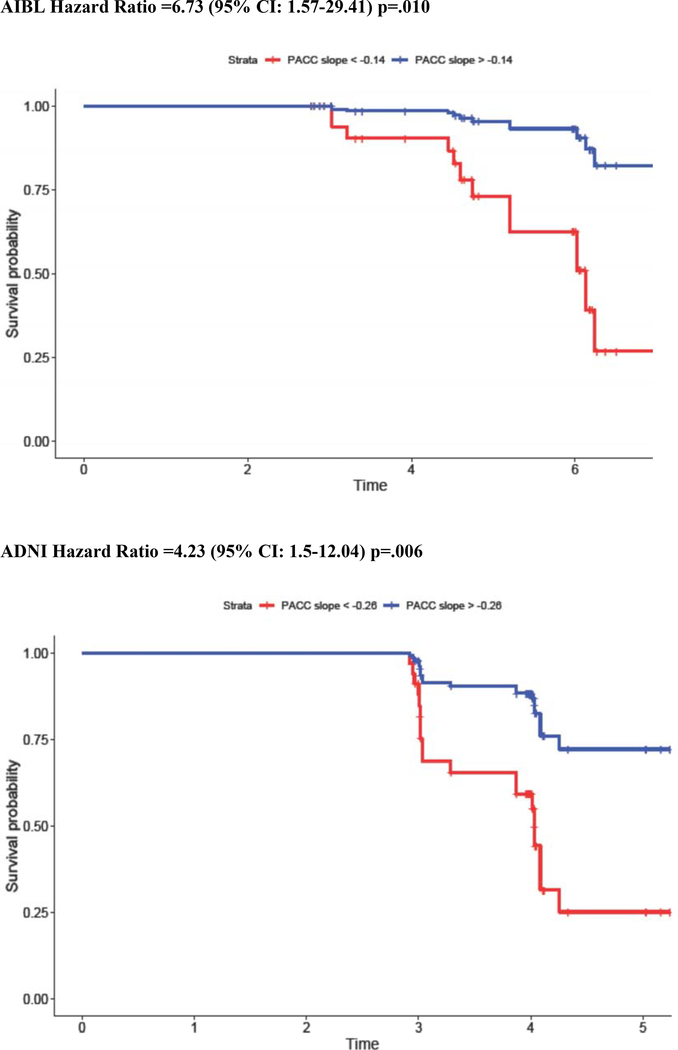
Figure 2.
Hazard Ratio for MCI Diagnosis in PACC Decliners: Visualization of Model Results
NOTE. Kaplan Meier curves showing the relative risk of MCI diagnosis among initially clinically normal but Aβ+ older adults with steeper (red) versus more stable (blue) PACC slopes in the preceding 3 years. PACC slope is dichotomized into steep versus stable groups using the bottom tertile.


