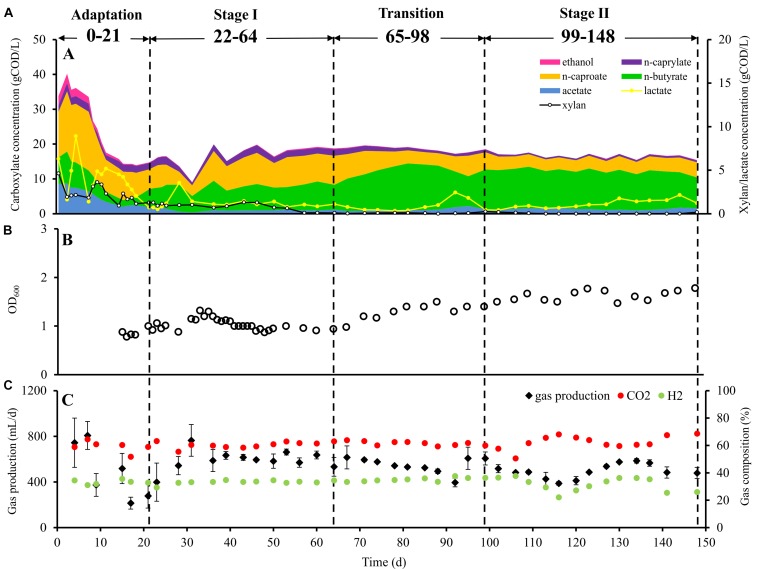
FIGURE 1.
Performance of bioreactor. (A) Substrate and product concentrations in the bioreactor during the four succession stages, (B) cell concentration (OD600 value) in the bioreactor during the four succession stages, and (C) daily gas production and gas composition during the four succession stages. Data points for gas production indicate mean values of 3 days. Within 95% confidence intervals, the error bars represent the standard deviation.

