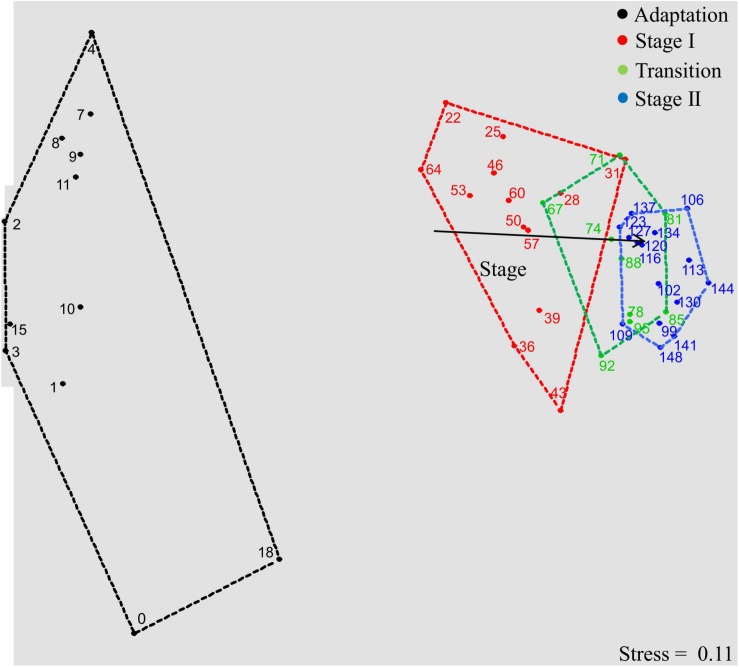
FIGURE 2.
Bacterial community dynamics in the four succession stages, illustrated by a non-metric multidimensional scaling (NMDS) plot of T-RFLP profiles (16S rRNA gene amplicons, restriction enzyme RsaI; the plot based on MspI is shown in Supplementary Figure S1). Data points are named according to sampling days. Proximity of data points represents community similarity based on the Bray-Curtis index. Colored polygons indicate sampling days of each process stage. The vector shows community shifts within the temporal dynamics (P < 0.01, significance calculated by Monte-Carlo test with 999 permutations).

