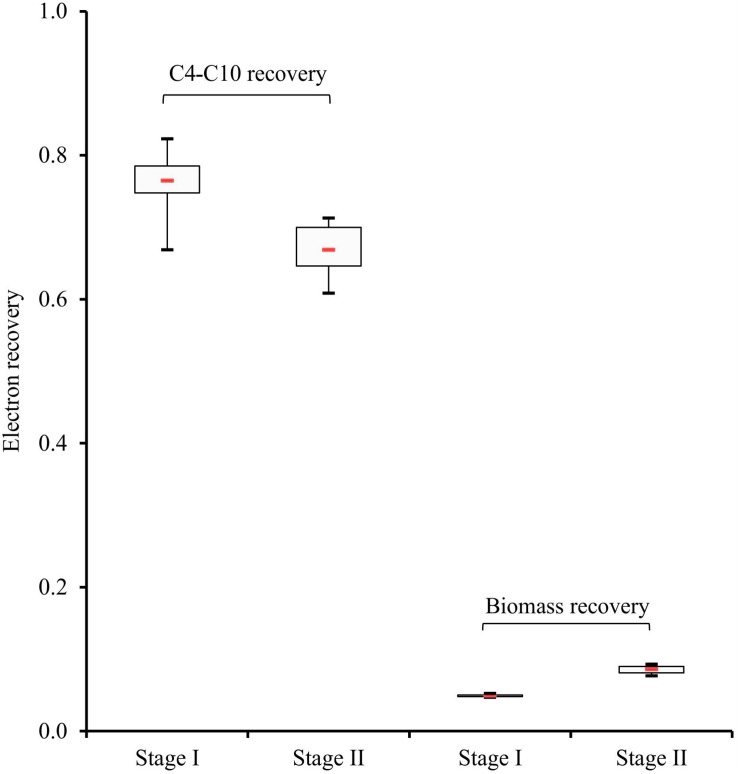
FIGURE 4.
Electron recoveries in carboxylates (C4-C10) and cell biomass, represented by 95% confidence intervals. Boxes indicate the interquartile range between the 25th and 75th percentiles, respectively, the red line inside indicates the median value, mean values between both stages show significant differences (P < 0.05).

